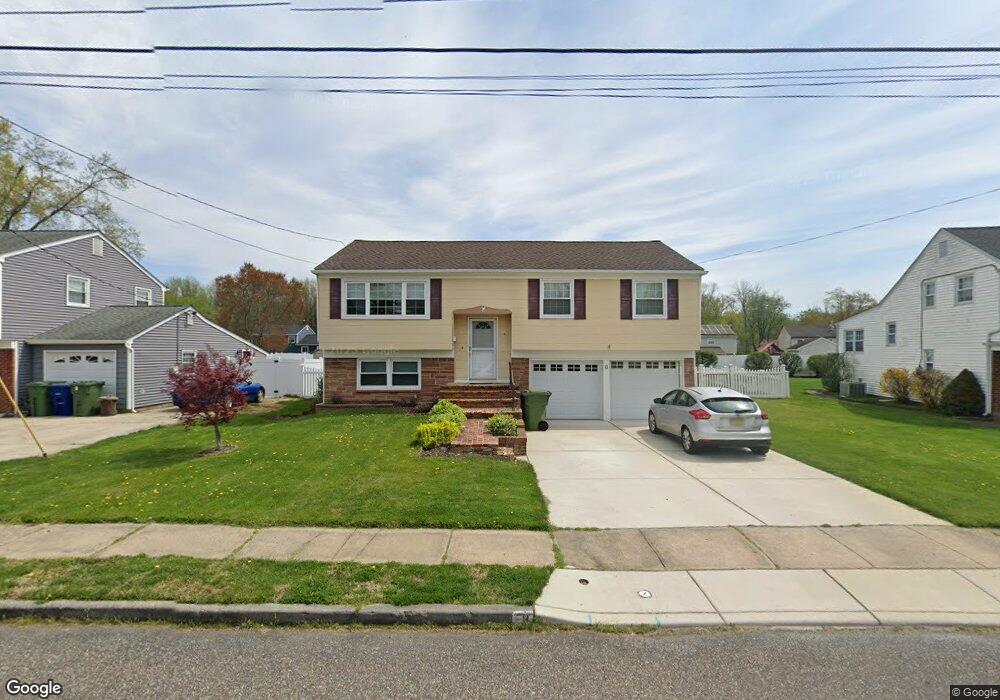
8 Lanfair Rd Marlton, NJ 08053
Estimated Value: $410,000 - $443,642
--
Bed
--
Bath
1,638
Sq Ft
$265/Sq Ft
Est. Value
About This Home
This home is located at 8 Lanfair Rd, Marlton, NJ 08053 and is currently estimated at $433,661, approximately $264 per square foot. 8 Lanfair Rd is a home located in Burlington County with nearby schools including H.L. Beeler Elementary School, Marlton Middle School, and Cherokee High School.
Ownership History
Date
Name
Owned For
Owner Type
Purchase Details
Closed on
Jun 10, 2005
Sold by
Baker Mary Ann E
Bought by
Appleman Christen A and Appleman John H
Current Estimated Value
Home Financials for this Owner
Home Financials are based on the most recent Mortgage that was taken out on this home.
Original Mortgage
$200,000
Outstanding Balance
$150,224
Interest Rate
5.71%
Mortgage Type
Fannie Mae Freddie Mac
Estimated Equity
$283,437
Create a Home Valuation Report for This Property
The Home Valuation Report is an in-depth analysis detailing your home's value as well as a comparison with similar homes in the area
Home Values in the Area
Average Home Value in this Area
Purchase History
| Date | Buyer | Sale Price | Title Company |
|---|---|---|---|
| Appleman Christen A | $250,000 | Congress Title Corp |
Source: Public Records
Mortgage History
| Date | Status | Borrower | Loan Amount |
|---|---|---|---|
| Open | Appleman Christen A | $200,000 |
Source: Public Records
Tax History Compared to Growth
Tax History
| Year | Tax Paid | Tax Assessment Tax Assessment Total Assessment is a certain percentage of the fair market value that is determined by local assessors to be the total taxable value of land and additions on the property. | Land | Improvement |
|---|---|---|---|---|
| 2025 | $7,984 | $233,800 | $115,000 | $118,800 |
| 2024 | $7,512 | $233,800 | $115,000 | $118,800 |
| 2023 | $7,512 | $233,800 | $115,000 | $118,800 |
| 2022 | $7,175 | $233,800 | $115,000 | $118,800 |
| 2021 | $6,757 | $233,800 | $115,000 | $118,800 |
| 2020 | $6,916 | $233,800 | $115,000 | $118,800 |
| 2019 | $6,860 | $233,800 | $115,000 | $118,800 |
| 2018 | $6,764 | $233,800 | $115,000 | $118,800 |
| 2017 | $6,434 | $233,800 | $115,000 | $118,800 |
| 2016 | $6,271 | $233,800 | $115,000 | $118,800 |
| 2015 | $6,156 | $233,800 | $115,000 | $118,800 |
| 2014 | $5,974 | $233,800 | $115,000 | $118,800 |
Source: Public Records
Map
Nearby Homes