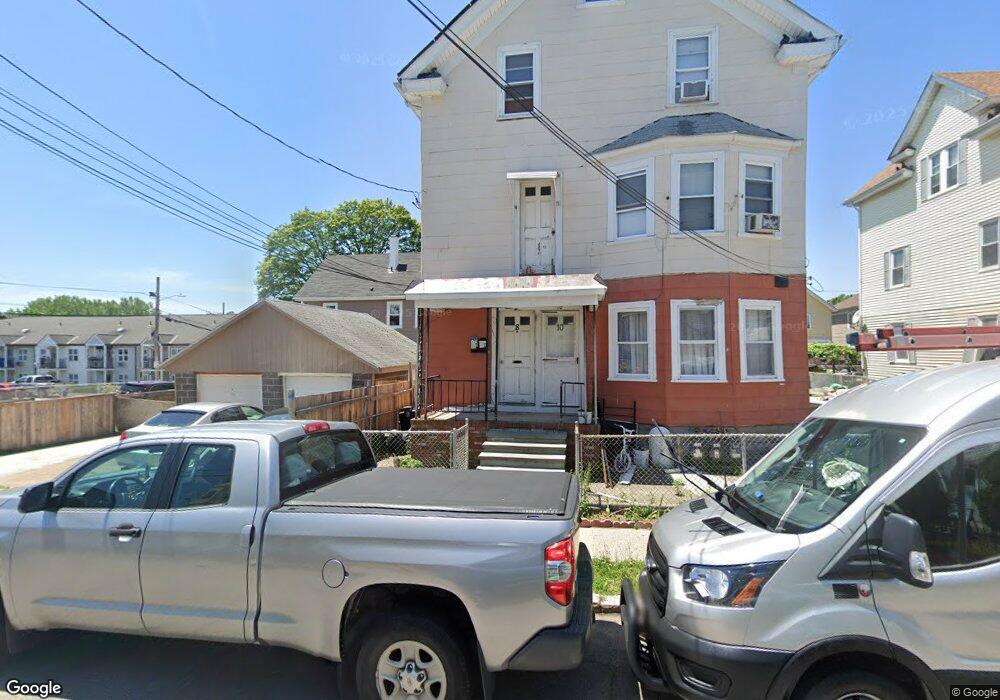
8 Larch St Pawtucket, RI 02860
Fairlawn NeighborhoodEstimated Value: $592,442 - $637,000
9
Beds
3
Baths
3,393
Sq Ft
$180/Sq Ft
Est. Value
About This Home
This home is located at 8 Larch St, Pawtucket, RI 02860 and is currently estimated at $610,611, approximately $179 per square foot. 8 Larch St is a home located in Providence County with nearby schools including Blackstone Valley Prep Upper Elementary School, International Charter School, and Blackstone Valley Prep Junior High School.
Ownership History
Date
Name
Owned For
Owner Type
Purchase Details
Closed on
Nov 6, 2024
Sold by
Mame Malam and Deustche Bk Natl T Co Tr
Bought by
Terwin Mortgae T and Deustche Bk Natl T Co Tr
Current Estimated Value
Purchase Details
Closed on
Sep 14, 2015
Sold by
Pawtucket Water Supply and Pawtucket Town Of
Bought by
Mane Malan
Purchase Details
Closed on
Aug 17, 2006
Sold by
Paz Jose L
Bought by
Mane Malam
Home Financials for this Owner
Home Financials are based on the most recent Mortgage that was taken out on this home.
Original Mortgage
$275,200
Interest Rate
6.88%
Mortgage Type
Purchase Money Mortgage
Purchase Details
Closed on
Oct 21, 2002
Sold by
Monteiro Ildo S and Monteiro Isaura P
Bought by
Paz Jose L
Create a Home Valuation Report for This Property
The Home Valuation Report is an in-depth analysis detailing your home's value as well as a comparison with similar homes in the area
Home Values in the Area
Average Home Value in this Area
Purchase History
| Date | Buyer | Sale Price | Title Company |
|---|---|---|---|
| Terwin Mortgae T | $242,397 | None Available | |
| Terwin Mortgae T | $242,397 | None Available | |
| Mane Malan | $1,414 | -- | |
| Mane Malan | $1,414 | -- | |
| Mane Malam | $344,000 | -- | |
| Mane Malam | $344,000 | -- | |
| Paz Jose L | $195,000 | -- | |
| Paz Jose L | $195,000 | -- |
Source: Public Records
Mortgage History
| Date | Status | Borrower | Loan Amount |
|---|---|---|---|
| Previous Owner | Paz Jose L | $275,200 | |
| Previous Owner | Paz Jose L | $68,800 |
Source: Public Records
Tax History Compared to Growth
Tax History
| Year | Tax Paid | Tax Assessment Tax Assessment Total Assessment is a certain percentage of the fair market value that is determined by local assessors to be the total taxable value of land and additions on the property. | Land | Improvement |
|---|---|---|---|---|
| 2025 | $6,116 | $465,100 | $118,300 | $346,800 |
| 2024 | $5,739 | $465,100 | $118,300 | $346,800 |
| 2023 | $5,262 | $310,600 | $53,200 | $257,400 |
| 2022 | $5,148 | $310,500 | $53,200 | $257,300 |
| 2021 | $5,148 | $310,500 | $53,200 | $257,300 |
| 2020 | $4,293 | $205,500 | $53,900 | $151,600 |
| 2019 | $4,293 | $205,500 | $53,900 | $151,600 |
| 2018 | $4,137 | $205,500 | $53,900 | $151,600 |
| 2017 | $3,912 | $172,200 | $41,000 | $131,200 |
| 2016 | $3,769 | $172,200 | $41,000 | $131,200 |
| 2015 | $3,769 | $172,200 | $41,000 | $131,200 |
| 2014 | $3,189 | $138,300 | $52,700 | $85,600 |
Source: Public Records
Map
Nearby Homes