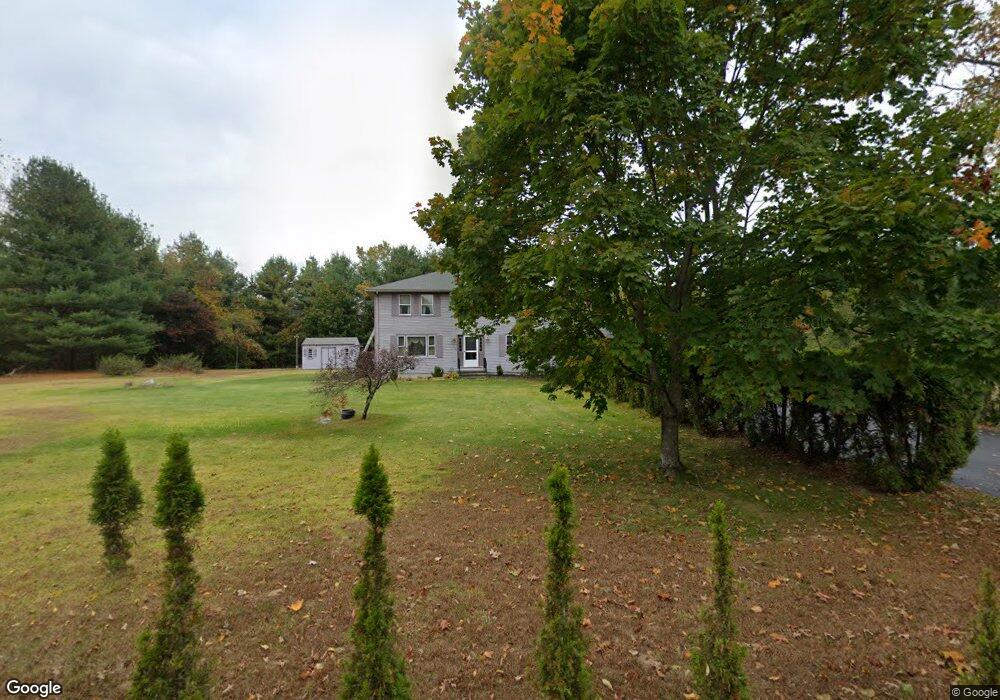
8 Larned Rd Oxford, MA 01540
Estimated Value: $531,182 - $631,000
4
Beds
3
Baths
2,352
Sq Ft
$251/Sq Ft
Est. Value
About This Home
This home is located at 8 Larned Rd, Oxford, MA 01540 and is currently estimated at $591,296, approximately $251 per square foot. 8 Larned Rd is a home located in Worcester County with nearby schools including Alfred M Chaffee, Oxford High School, and Clara Barton Elementary School.
Ownership History
Date
Name
Owned For
Owner Type
Purchase Details
Closed on
May 15, 2020
Sold by
Kosel Peter J
Bought by
Kosel Peter J and Kosel Maureen
Current Estimated Value
Purchase Details
Closed on
Jul 28, 2017
Sold by
Kosel Peter J and Kosel Maureen
Bought by
Kosel Peter J
Purchase Details
Closed on
May 31, 1988
Sold by
Powers Fred T
Bought by
Brassard Kevin F
Home Financials for this Owner
Home Financials are based on the most recent Mortgage that was taken out on this home.
Original Mortgage
$105,000
Interest Rate
10.18%
Mortgage Type
Purchase Money Mortgage
Create a Home Valuation Report for This Property
The Home Valuation Report is an in-depth analysis detailing your home's value as well as a comparison with similar homes in the area
Home Values in the Area
Average Home Value in this Area
Purchase History
| Date | Buyer | Sale Price | Title Company |
|---|---|---|---|
| Kosel Peter J | -- | None Available | |
| Kosel Peter J | -- | -- | |
| Brassard Kevin F | $165,000 | -- |
Source: Public Records
Mortgage History
| Date | Status | Borrower | Loan Amount |
|---|---|---|---|
| Previous Owner | Brassard Kevin F | $30,000 | |
| Previous Owner | Brassard Kevin F | $105,000 |
Source: Public Records
Tax History
| Year | Tax Paid | Tax Assessment Tax Assessment Total Assessment is a certain percentage of the fair market value that is determined by local assessors to be the total taxable value of land and additions on the property. | Land | Improvement |
|---|---|---|---|---|
| 2025 | $60 | $469,800 | $121,500 | $348,300 |
| 2024 | $5,814 | $431,300 | $112,300 | $319,000 |
| 2023 | $5,296 | $388,300 | $100,300 | $288,000 |
| 2022 | $5,077 | $314,200 | $70,000 | $244,200 |
| 2021 | $4,896 | $296,200 | $66,400 | $229,800 |
| 2020 | $4,715 | $283,000 | $66,400 | $216,600 |
| 2019 | $4,607 | $270,500 | $66,500 | $204,000 |
| 2018 | $4,290 | $248,400 | $66,500 | $181,900 |
| 2017 | $4,302 | $255,300 | $66,500 | $188,800 |
| 2016 | $4,322 | $255,300 | $66,500 | $188,800 |
| 2015 | $4,031 | $255,300 | $66,500 | $188,800 |
| 2014 | $3,965 | $264,300 | $66,500 | $197,800 |
Source: Public Records
Map
Nearby Homes
- 43 Larned Rd
- 13 Harwood St
- 5 Maid Marion St
- 113 Main St
- 20-22 Bacon St
- 17 Hugo Terrace
- 0 Old Southbridge Rd
- 39 Fairlawn Ave
- 14 Walnut St
- 71 Charlton St
- 35 Pine Ridge Dr
- 2 Melissa Ln
- 13 Dolge Ct
- 4 Toria Heights Rd
- 9 Howarth Rd
- 18 Kingsbury Rd
- 29 Charlton St
- 58 Lelandville Rd
- L0T 3 History Dr
- 66 Racicot Ave
Your Personal Tour Guide
Ask me questions while you tour the home.