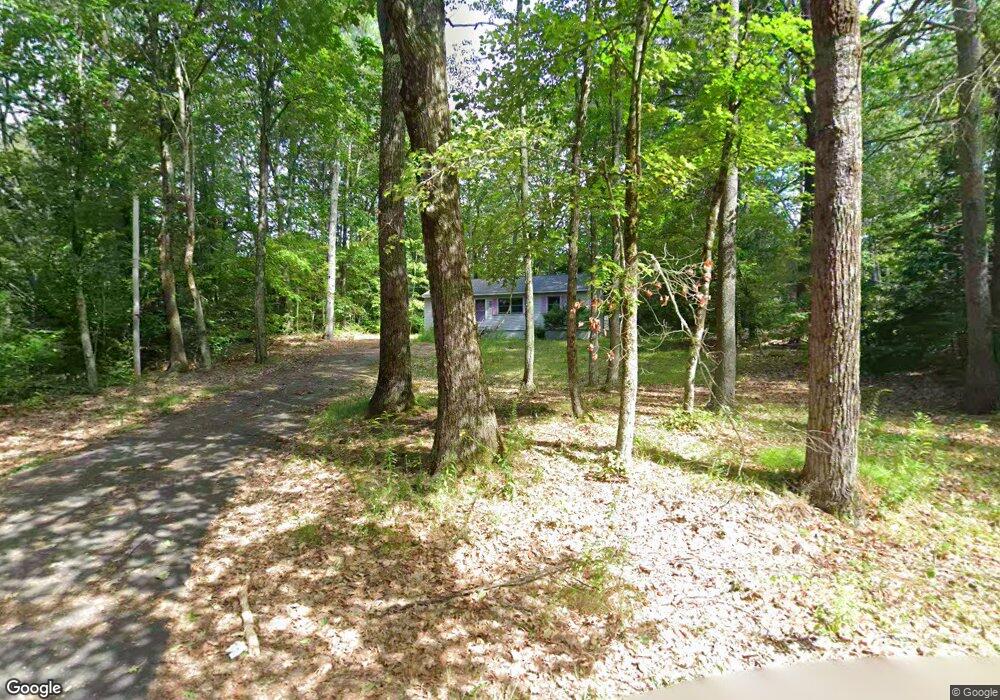
8 Laurel Dr Unit 1 Ashburnham, MA 01430
Estimated Value: $286,000 - $298,000
2
Beds
1
Bath
800
Sq Ft
$366/Sq Ft
Est. Value
About This Home
This home is located at 8 Laurel Dr Unit 1, Ashburnham, MA 01430 and is currently estimated at $292,473, approximately $365 per square foot. 8 Laurel Dr Unit 1 is a home located in Worcester County with nearby schools including Oakmont Regional High School.
Ownership History
Date
Name
Owned For
Owner Type
Purchase Details
Closed on
Feb 8, 2005
Sold by
Conlon John
Bought by
Conlon Dona A
Current Estimated Value
Purchase Details
Closed on
Dec 2, 1996
Sold by
Maillet Ronald J
Bought by
Conlon John and Conlon Dona A
Home Financials for this Owner
Home Financials are based on the most recent Mortgage that was taken out on this home.
Original Mortgage
$30,000
Interest Rate
7.82%
Mortgage Type
Purchase Money Mortgage
Create a Home Valuation Report for This Property
The Home Valuation Report is an in-depth analysis detailing your home's value as well as a comparison with similar homes in the area
Home Values in the Area
Average Home Value in this Area
Purchase History
| Date | Buyer | Sale Price | Title Company |
|---|---|---|---|
| Conlon Dona A | -- | -- | |
| Conlon Dona A | -- | -- | |
| Conlon John | $95,000 | -- | |
| Conlon John | $95,000 | -- |
Source: Public Records
Mortgage History
| Date | Status | Borrower | Loan Amount |
|---|---|---|---|
| Previous Owner | Conlon John | $52,500 | |
| Previous Owner | Conlon John | $30,000 |
Source: Public Records
Tax History
| Year | Tax Paid | Tax Assessment Tax Assessment Total Assessment is a certain percentage of the fair market value that is determined by local assessors to be the total taxable value of land and additions on the property. | Land | Improvement |
|---|---|---|---|---|
| 2025 | $4,332 | $291,300 | $33,700 | $257,600 |
| 2024 | $4,193 | $266,200 | $33,700 | $232,500 |
| 2023 | $4,338 | $262,100 | $33,700 | $228,400 |
| 2022 | $4,288 | $227,100 | $33,500 | $193,600 |
| 2021 | $3,919 | $200,000 | $33,500 | $166,500 |
| 2020 | $0 | $200,000 | $33,500 | $166,500 |
| 2019 | $794 | $162,600 | $33,500 | $129,100 |
| 2018 | $3,622 | $154,800 | $32,000 | $122,800 |
| 2017 | $3,533 | $153,800 | $36,000 | $117,800 |
| 2016 | $3,474 | $152,700 | $35,300 | $117,400 |
| 2015 | $3,402 | $152,700 | $35,300 | $117,400 |
Source: Public Records
Map
Nearby Homes
- 8 Laurel Dr
- 0 Winding Cove Rd Unit 73431444
- 207 Sherbert Rd
- 162 Sherbert Rd
- 6 Wyman Rd
- 119 W Shore Dr
- 98 Goldmine Rd
- 358 Winchendon Rd
- 495 Winchendon Rd
- Lot 3 W State Rd
- Lot 40C Winchendon Rd
- 1 Roberts Way
- 750 Teel Rd
- - Gardner Rd
- 150-152 Mill Cir
- 226 Lakeview Dr
- 431 Teel Rd
- 11 Colonial Ln
- 16 Maple Place
- 226 Glenallen St
Your Personal Tour Guide
Ask me questions while you tour the home.