Estimated Value: $79,797 - $217,000
--
Bed
--
Bath
896
Sq Ft
$156/Sq Ft
Est. Value
About This Home
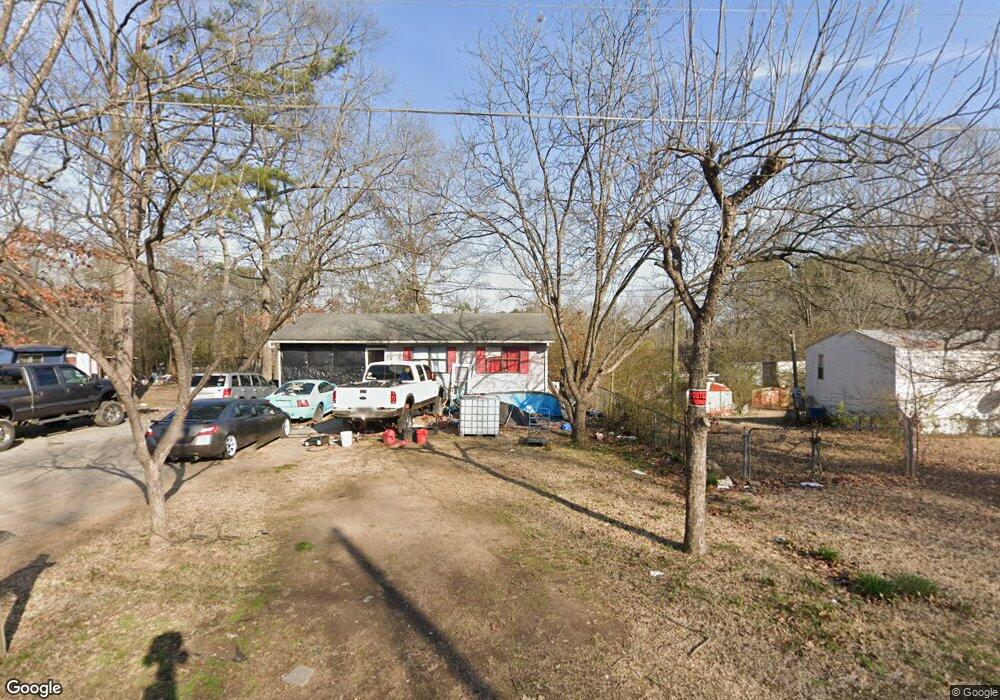
This home is located at 8 Lee St NW, Rome, GA 30165 and is currently estimated at $139,449, approximately $155 per square foot. 8 Lee St NW is a home located in Floyd County with nearby schools including Coosa Middle School and Coosa High School.
Ownership History
Date
Name
Owned For
Owner Type
Purchase Details
Closed on
Aug 2, 2010
Sold by
Mcstotts Chuck
Bought by
Tate Roger L
Current Estimated Value
Purchase Details
Closed on
Dec 14, 2009
Sold by
Cornejo Tammy
Bought by
Mcstotts Chuck
Purchase Details
Closed on
Jun 18, 2004
Sold by
Mcstotts Chuck
Bought by
Mitchell Tammy
Purchase Details
Closed on
Nov 20, 2003
Sold by
Tcif Re02 Llc
Bought by
Mcstotts Chuck
Purchase Details
Closed on
Jun 3, 2003
Sold by
Fortune Kenneth N
Bought by
Tcif Re02 Llc
Purchase Details
Closed on
Oct 18, 1989
Sold by
Jim Walter Homes Inc
Bought by
Fortune Kenneth N
Purchase Details
Closed on
Jul 11, 1989
Sold by
Hammett Betty R and James Leon
Bought by
Jim Walter Homes Inc
Purchase Details
Closed on
Jan 1, 1988
Sold by
Hammett Perry Len
Bought by
Hammett Betty R and James Leon
Purchase Details
Closed on
Sep 14, 1981
Sold by
Hammett Sherman
Bought by
Hammett Perry Len
Purchase Details
Closed on
Jun 9, 1978
Bought by
Hammett Sherman
Create a Home Valuation Report for This Property
The Home Valuation Report is an in-depth analysis detailing your home's value as well as a comparison with similar homes in the area
Home Values in the Area
Average Home Value in this Area
Purchase History
| Date | Buyer | Sale Price | Title Company |
|---|---|---|---|
| Tate Roger L | $18,000 | -- | |
| Mcstotts Chuck | -- | -- | |
| Mitchell Tammy | $42,500 | -- | |
| Mcstotts Chuck | $19,300 | -- | |
| Tcif Re02 Llc | $15,600 | -- | |
| Fortune Kenneth N | $26,000 | -- | |
| Jim Walter Homes Inc | $24,500 | -- | |
| Hammett Betty R | $1,000 | -- | |
| Hammett Perry Len | -- | -- | |
| Hammett Sherman | -- | -- |
Source: Public Records
Tax History Compared to Growth
Tax History
| Year | Tax Paid | Tax Assessment Tax Assessment Total Assessment is a certain percentage of the fair market value that is determined by local assessors to be the total taxable value of land and additions on the property. | Land | Improvement |
|---|---|---|---|---|
| 2024 | $707 | $23,262 | $1,432 | $21,830 |
| 2023 | $666 | $22,712 | $1,302 | $21,410 |
| 2022 | $623 | $20,981 | $1,042 | $19,939 |
| 2021 | $576 | $19,088 | $1,042 | $18,046 |
| 2020 | $549 | $18,048 | $781 | $17,267 |
| 2019 | $516 | $17,192 | $781 | $16,411 |
| 2018 | $479 | $15,934 | $781 | $15,153 |
| 2017 | $467 | $15,502 | $781 | $14,721 |
| 2016 | $464 | $15,218 | $760 | $14,458 |
| 2015 | $454 | $15,218 | $760 | $14,458 |
| 2014 | $454 | $15,218 | $760 | $14,458 |
Source: Public Records
Map
Nearby Homes
- 18 Lee St NW
- 87 Northside Dr NW
- 22 Wet Oak Dr NW
- 30 Polaris Terrace NW
- 293 N Avery Rd NW
- 3329 Alabama Hwy SW
- 89 Barker Rd SW
- 3105 Barker Rd SW
- 8 Kayla Dr NW
- 4003 Garden Lakes Pkwy NW
- 876 Barker Rd SW
- 224 Rolling Oaks Dr NW
- 48 Fox Croft Rd NW
- 215 Rollingwood Cir NW
- 212 Rolling Oaks Dr NW
- 48 Atwood Dr NW
- 2890 Alabama Hwy NW
- 106 Eden Dr NW
- 973 Barker Rd SW
- 124 Beech Creek Dr NW