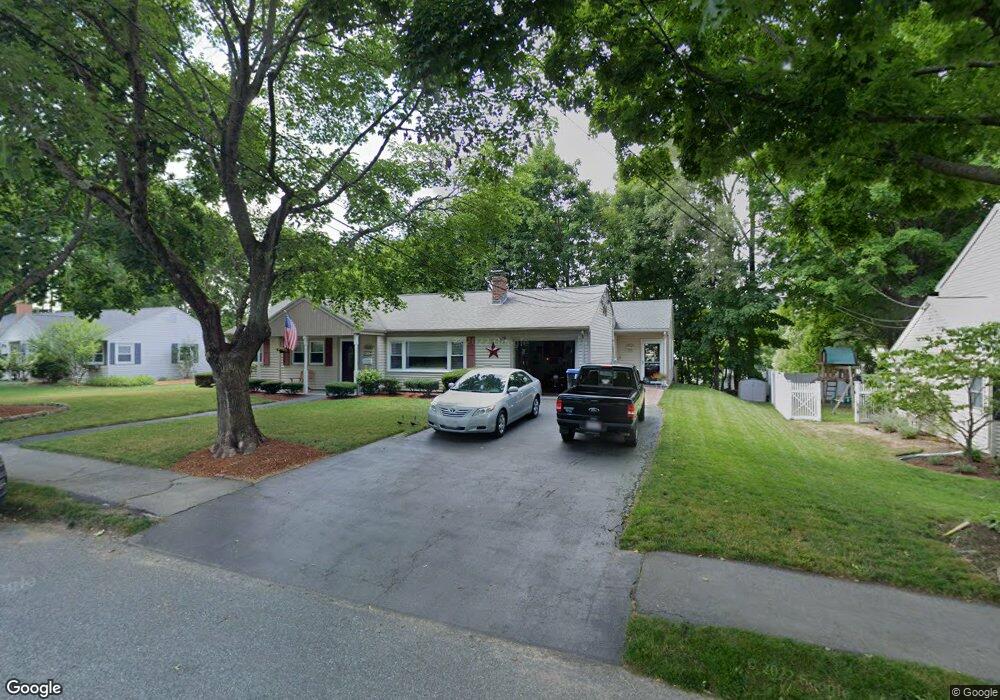
8 Leighton St Natick, MA 01760
Estimated Value: $747,000 - $946,000
4
Beds
3
Baths
1,712
Sq Ft
$504/Sq Ft
Est. Value
About This Home
This home is located at 8 Leighton St, Natick, MA 01760 and is currently estimated at $863,232, approximately $504 per square foot. 8 Leighton St is a home located in Middlesex County with nearby schools including Natick High School, Bennett-Hemenway (Ben-Hem) Elementary School, and Wilson Middle School.
Ownership History
Date
Name
Owned For
Owner Type
Purchase Details
Closed on
Dec 31, 1992
Sold by
Oreilly John B and Oreilly Janet L
Bought by
Lapham Michael A
Current Estimated Value
Home Financials for this Owner
Home Financials are based on the most recent Mortgage that was taken out on this home.
Original Mortgage
$104,000
Interest Rate
8.32%
Mortgage Type
Purchase Money Mortgage
Purchase Details
Closed on
Jul 31, 1990
Sold by
Meyers Frederick A
Bought by
Oreilly Janet L
Create a Home Valuation Report for This Property
The Home Valuation Report is an in-depth analysis detailing your home's value as well as a comparison with similar homes in the area
Home Values in the Area
Average Home Value in this Area
Purchase History
| Date | Buyer | Sale Price | Title Company |
|---|---|---|---|
| Lapham Michael A | $130,000 | -- | |
| Oreilly Janet L | $90,800 | -- |
Source: Public Records
Mortgage History
| Date | Status | Borrower | Loan Amount |
|---|---|---|---|
| Open | Oreilly Janet L | $100,000 | |
| Closed | Oreilly Janet L | $113,500 | |
| Closed | Oreilly Janet L | $115,000 | |
| Closed | Oreilly Janet L | $104,000 |
Source: Public Records
Tax History Compared to Growth
Tax History
| Year | Tax Paid | Tax Assessment Tax Assessment Total Assessment is a certain percentage of the fair market value that is determined by local assessors to be the total taxable value of land and additions on the property. | Land | Improvement |
|---|---|---|---|---|
| 2025 | $9,074 | $758,700 | $450,100 | $308,600 |
| 2024 | $8,767 | $715,100 | $425,100 | $290,000 |
| 2023 | $8,546 | $676,100 | $400,100 | $276,000 |
| 2022 | $8,301 | $622,300 | $365,100 | $257,200 |
| 2021 | $7,980 | $586,300 | $345,100 | $241,200 |
| 2020 | $7,775 | $571,300 | $330,100 | $241,200 |
| 2019 | $5,725 | $450,400 | $330,100 | $120,300 |
| 2018 | $9,910 | $390,600 | $300,100 | $90,500 |
| 2017 | $4,775 | $354,000 | $265,100 | $88,900 |
| 2016 | $4,589 | $338,200 | $250,100 | $88,100 |
| 2015 | $4,559 | $329,900 | $250,100 | $79,800 |
Source: Public Records
Map
Nearby Homes