J
Seller's Agent in 2017
John
RCG Properties
14 Total Sales

Estimated Value: $1,738,000 - $2,003,000
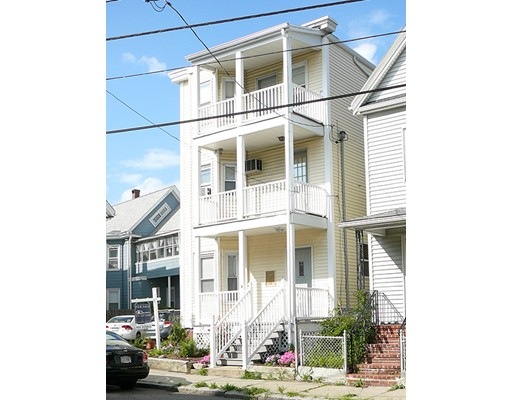
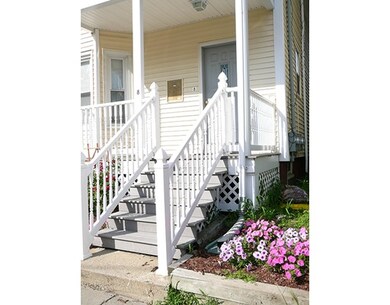
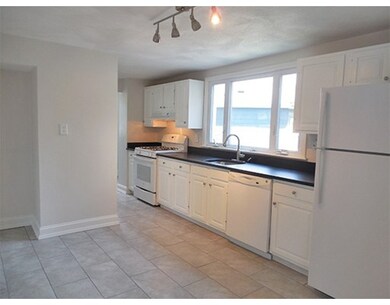
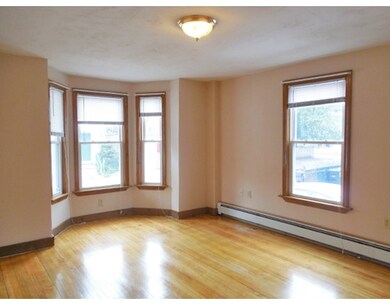
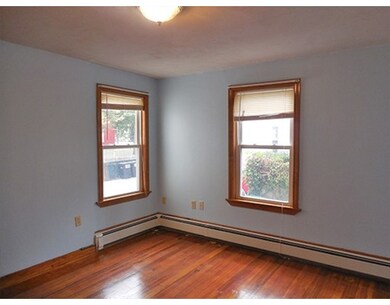
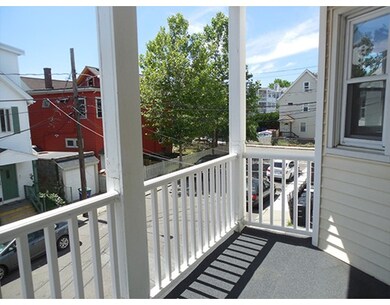
Multiple Offer Notification. All offers due by 5PM Tuesday 6-27. Turnkey 3 family In Inman Square. Offering a strong rental income and a great location. Annual income is $101,220 and property is fully occupied with lease dates ending 8-31-18. Steps to Inman and Union Squares with many great restaurants and shops.
Home Type
Multi-Family
Year Built
1920
Lot Details
2,614 Sq Ft Lot
We collect this data history from publicly available records. To have your information removed, we recommend requesting removal directly through your county’s website.
We collect this data history from publicly available records. To have your information removed, we recommend requesting removal directly through your county’s website.
| Date | Buyer | Sale Price | Title Company |
|---|---|---|---|
| $1,550,000 | -- | ||
| $960,000 | -- | ||
| $960,000 | -- |
We collect this data history from publicly available records. To have your information removed, we recommend requesting removal directly through your county’s website.
| Date | Status | Borrower | Loan Amount |
|---|---|---|---|
| Open | $1,162,500 | ||
| Previous Owner | $650,000 |
We collect this data history from publicly available records. To have your information removed, we recommend requesting removal directly through your county’s website.
| Date | Event | Price | List to Sale | Price per Sq Ft | Prior Sale |
|---|---|---|---|---|---|
| 09/05/2017 09/05/17 | Sold | $1,550,000 | 0.0% | $471 / Sq Ft | |
| 06/30/2017 06/30/17 | Pending | -- | -- | -- | |
| 06/23/2017 06/23/17 | For Sale | $1,550,000 | +61.5% | $471 / Sq Ft | |
| 08/29/2014 08/29/14 | Sold | $960,000 | -3.9% | $292 / Sq Ft | View Prior Sale |
| 07/30/2014 07/30/14 | Pending | -- | -- | -- | |
| 07/16/2014 07/16/14 | For Sale | $999,000 | -- | $304 / Sq Ft |
We collect this data history from publicly available records. To have your information removed, we recommend requesting removal directly through your county’s website.
| Year | Tax Paid | Tax Assessment Tax Assessment Total Assessment is a certain percentage of the fair market value that is determined by local assessors to be the total taxable value of land and additions on the property. | Land | Improvement |
|---|---|---|---|---|
| 2025 | $20,705 | $1,897,800 | $698,400 | $1,199,400 |
| 2024 | $19,413 | $1,845,300 | $698,400 | $1,146,900 |
| 2023 | $18,944 | $1,832,100 | $698,400 | $1,133,700 |
| 2022 | $18,090 | $1,777,000 | $665,100 | $1,111,900 |
| 2021 | $17,383 | $1,705,900 | $633,400 | $1,072,500 |
| 2020 | $16,967 | $1,681,600 | $609,100 | $1,072,500 |
| 2019 | $15,692 | $1,458,400 | $517,200 | $941,200 |
| 2018 | $11,779 | $1,041,500 | $470,200 | $571,300 |
| 2017 | $11,299 | $968,200 | $425,800 | $542,400 |
| 2016 | $11,135 | $888,700 | $418,600 | $470,100 |
| 2015 | $9,024 | $715,600 | $386,100 | $329,500 |
J
Seller's Agent in 2017
John
RCG Properties
14 Total Sales
N
Seller's Agent in 2014
Nick Kondilis
Steve Bremis Realty Group
(617) 230-0215
4 Total Sales
Source: MLS Property Information Network (MLS PIN)
MLS Number: 72188745
APN: SOME-000076-C000000-000020
Disclaimer: Certain information contained herein is derived from information provided by parties other than Homes.com. All information provided is deemed reliable, but is not guaranteed to be accurate and should be independently verified.
![]() The property listing data and information, or the Images, set forth herein were provided to MLS Property Information Network, Inc. from third party sources, including sellers, lessors and public records, and were compiled by MLS Property Information Network, Inc. The property listing data and information, and the Images, are for the personal, non-commercial use of consumers having a good faith interest in purchasing or leasing listed properties of the type displayed to them and may not be used for any purpose other than to identify prospective properties which such consumers may have a good faith interest in purchasing or leasing. MLS Property Information Network, Inc. and its subscribers disclaim any and all representations and warranties as to the accuracy of the property listing data and information, or as to the accuracy of any of the Images, set forth herein.
The property listing data and information, or the Images, set forth herein were provided to MLS Property Information Network, Inc. from third party sources, including sellers, lessors and public records, and were compiled by MLS Property Information Network, Inc. The property listing data and information, and the Images, are for the personal, non-commercial use of consumers having a good faith interest in purchasing or leasing listed properties of the type displayed to them and may not be used for any purpose other than to identify prospective properties which such consumers may have a good faith interest in purchasing or leasing. MLS Property Information Network, Inc. and its subscribers disclaim any and all representations and warranties as to the accuracy of the property listing data and information, or as to the accuracy of any of the Images, set forth herein.
Ask me questions while you tour the home.
