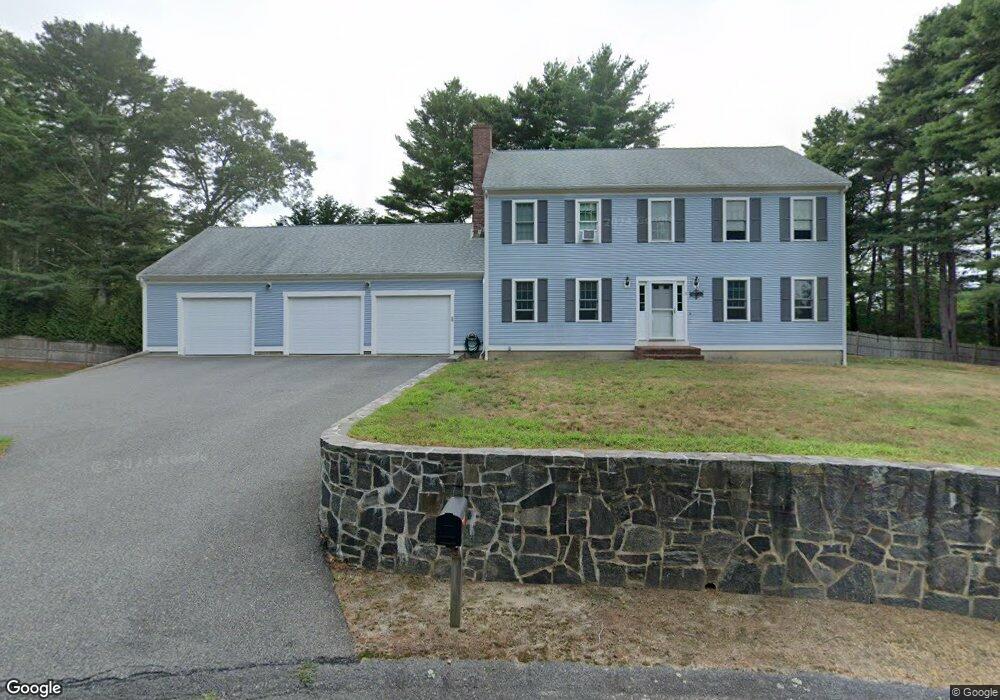
8 Leslie Cir Pocasset, MA 02559
Monument Beach NeighborhoodEstimated Value: $810,000
3
Beds
3
Baths
2,201
Sq Ft
$368/Sq Ft
Est. Value
About This Home
This home is located at 8 Leslie Cir, Pocasset, MA 02559 and is currently priced at $810,000, approximately $368 per square foot. 8 Leslie Cir is a home located in Barnstable County with nearby schools including Bourne High School, Cadence Academy Preschool - Bourne, and St Margaret Regional School.
Ownership History
Date
Name
Owned For
Owner Type
Purchase Details
Closed on
Aug 30, 1999
Sold by
Degan Donald M
Bought by
Woodside Dennis R
Current Estimated Value
Home Financials for this Owner
Home Financials are based on the most recent Mortgage that was taken out on this home.
Original Mortgage
$150,000
Interest Rate
7.53%
Mortgage Type
Purchase Money Mortgage
Purchase Details
Closed on
Sep 1, 1992
Sold by
Harwood Julian F
Bought by
Degan Frances M and Degan Donald M
Create a Home Valuation Report for This Property
The Home Valuation Report is an in-depth analysis detailing your home's value as well as a comparison with similar homes in the area
Home Values in the Area
Average Home Value in this Area
Purchase History
| Date | Buyer | Sale Price | Title Company |
|---|---|---|---|
| Woodside Dennis R | $245,000 | -- | |
| Degan Frances M | $62,000 | -- |
Source: Public Records
Mortgage History
| Date | Status | Borrower | Loan Amount |
|---|---|---|---|
| Open | Degan Frances M | $150,000 | |
| Closed | Degan Frances M | $150,000 | |
| Previous Owner | Degan Frances M | $140,000 | |
| Previous Owner | Degan Frances M | $140,000 |
Source: Public Records
Tax History Compared to Growth
Tax History
| Year | Tax Paid | Tax Assessment Tax Assessment Total Assessment is a certain percentage of the fair market value that is determined by local assessors to be the total taxable value of land and additions on the property. | Land | Improvement |
|---|---|---|---|---|
| 2025 | $4,896 | $626,900 | $0 | $0 |
| 2024 | $4,787 | $596,900 | $188,900 | $408,000 |
| 2023 | $4,694 | $532,800 | $167,200 | $365,600 |
| 2022 | $4,421 | $438,200 | $148,000 | $290,200 |
| 2021 | $4,169 | $387,100 | $134,700 | $252,400 |
| 2020 | $4,072 | $379,100 | $133,400 | $245,700 |
| 2019 | $3,868 | $368,000 | $133,400 | $234,600 |
| 2018 | $3,695 | $350,600 | $127,100 | $223,500 |
| 2017 | $3,483 | $338,200 | $119,600 | $218,600 |
| 2016 | $3,384 | $333,100 | $119,600 | $213,500 |
| 2015 | $3,227 | $320,500 | $107,000 | $213,500 |
Source: Public Records
Map
Nearby Homes
- 566 Shore Rd
- 501 County Rd
- 515 County Rd
- 18 Douglas Ave
- 39 Bennets Neck Dr
- 30 Howard Ave
- 14 Navajo Rd
- 18 Carlton Rd
- 105 Clay Pond Rd
- 93 Valley Bars Rd
- 254 Barlows Landing Rd
- 709 County Rd
- 70 Wings Neck Rd
- 940 County Rd
- 174 Barlows Landing Rd
- 24 Richmond Rd
- 12 Beachwood Rd
- 15 1st St
- 34 Kenwood Rd
- 45 Kenwood Rd