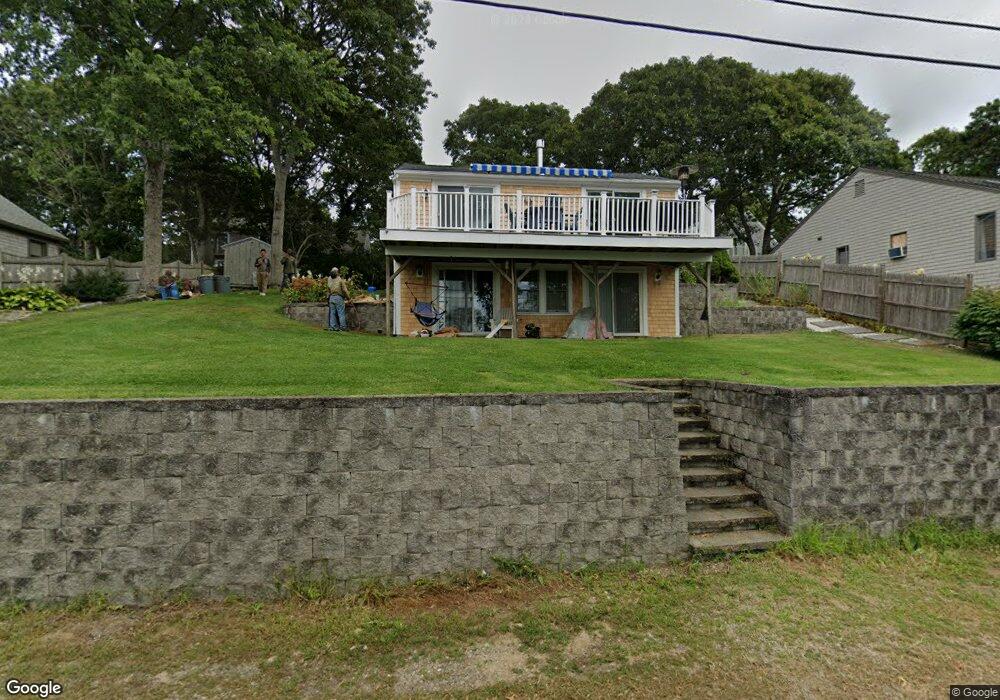
8 Leslie Ln Yarmouth Port, MA 02675
Yarmouth Port NeighborhoodEstimated Value: $746,000 - $891,000
2
Beds
1
Bath
672
Sq Ft
$1,208/Sq Ft
Est. Value
About This Home
This home is located at 8 Leslie Ln, Yarmouth Port, MA 02675 and is currently estimated at $811,481, approximately $1,207 per square foot. 8 Leslie Ln is a home located in Barnstable County with nearby schools including Dennis-Yarmouth Regional High School and St. Pius X. School.
Ownership History
Date
Name
Owned For
Owner Type
Purchase Details
Closed on
Sep 20, 2021
Sold by
Oquinn Elizabeth
Bought by
E A O Quinn 2021 T
Current Estimated Value
Purchase Details
Closed on
Jun 19, 2006
Sold by
Watson Kenneth D
Bought by
Oquinn Elizabeth
Home Financials for this Owner
Home Financials are based on the most recent Mortgage that was taken out on this home.
Original Mortgage
$280,000
Interest Rate
6.62%
Mortgage Type
Purchase Money Mortgage
Purchase Details
Closed on
Aug 12, 1997
Sold by
Caplan Selma
Bought by
Skweres Karyn E and Watson Kenneth D
Home Financials for this Owner
Home Financials are based on the most recent Mortgage that was taken out on this home.
Original Mortgage
$102,863
Interest Rate
7.5%
Mortgage Type
Purchase Money Mortgage
Create a Home Valuation Report for This Property
The Home Valuation Report is an in-depth analysis detailing your home's value as well as a comparison with similar homes in the area
Home Values in the Area
Average Home Value in this Area
Purchase History
| Date | Buyer | Sale Price | Title Company |
|---|---|---|---|
| E A O Quinn 2021 T | -- | None Available | |
| Oquinn Elizabeth | $280,000 | -- | |
| Skweres Karyn E | $104,000 | -- |
Source: Public Records
Mortgage History
| Date | Status | Borrower | Loan Amount |
|---|---|---|---|
| Previous Owner | Oquinn Elizabeth | $280,000 | |
| Previous Owner | Skweres Karyn E | $102,863 |
Source: Public Records
Tax History Compared to Growth
Tax History
| Year | Tax Paid | Tax Assessment Tax Assessment Total Assessment is a certain percentage of the fair market value that is determined by local assessors to be the total taxable value of land and additions on the property. | Land | Improvement |
|---|---|---|---|---|
| 2025 | $5,542 | $782,700 | $436,600 | $346,100 |
| 2024 | $5,148 | $697,500 | $379,700 | $317,800 |
| 2023 | $4,781 | $589,500 | $309,900 | $279,600 |
| 2022 | $4,596 | $500,600 | $278,400 | $222,200 |
| 2021 | $4,298 | $449,600 | $261,600 | $188,000 |
| 2020 | $4,174 | $417,400 | $249,900 | $167,500 |
| 2019 | $3,862 | $382,400 | $249,900 | $132,500 |
| 2018 | $3,806 | $369,900 | $237,400 | $132,500 |
| 2017 | $3,706 | $369,900 | $237,400 | $132,500 |
| 2016 | $3,692 | $369,900 | $237,400 | $132,500 |
| 2015 | $3,555 | $354,100 | $237,400 | $116,700 |
Source: Public Records
Map
Nearby Homes
- 4 Ebb Rd
- 153 Bayridge Dr
- 11 Uncle Stanleys Way
- 118 Driftwood Ln
- 15 Captain Jud Rd
- 13 Covey Dr
- 17 Margate Ln
- 129 Driftwood Ln
- 111 Merchant Ave
- 17 Fairmount Rd
- 17 Fairmount Rd
- 10 Joanne Dr
- 7 Vinland Dr
- 6 Nimble Hill Dr
- 25 Skerry Rd
- 4 Old Colony Way
- 1 Norseman Dr
- 59 Main St Unit 19-2
- 59 Route 6a Unit 29-4
- 62 Old Fish House Rd