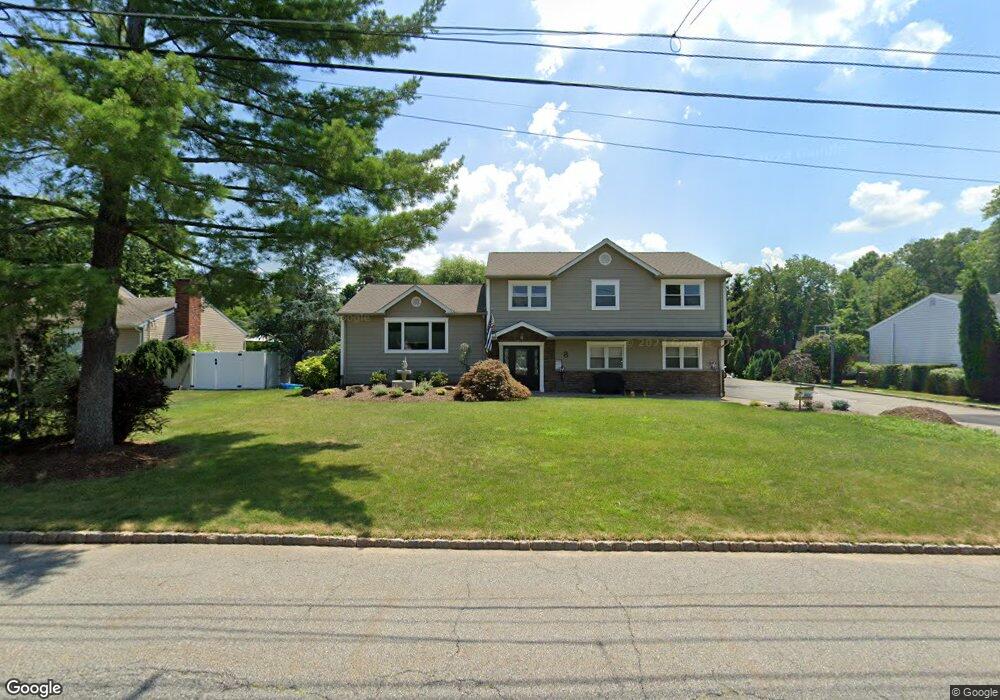
8 Lyons Place East Hanover, NJ 07936
Estimated Value: $1,084,000 - $1,458,000
--
Bed
--
Bath
3,691
Sq Ft
$345/Sq Ft
Est. Value
About This Home
This home is located at 8 Lyons Place, East Hanover, NJ 07936 and is currently estimated at $1,274,698, approximately $345 per square foot. 8 Lyons Place is a home located in Morris County with nearby schools including Frank J. Smith Elementary School, Central Elementary School, and East Hanover Middle School.
Ownership History
Date
Name
Owned For
Owner Type
Purchase Details
Closed on
Jan 26, 2024
Sold by
Peluso Giuseppe and Peluso Susan
Bought by
Ott Jamie and Ott Natalina
Current Estimated Value
Purchase Details
Closed on
Dec 8, 2011
Sold by
Gnp1 Llc
Bought by
Gnp1 Llc
Purchase Details
Closed on
Dec 30, 2002
Sold by
Peluso Lucia
Bought by
Peluso Giuseppe
Home Financials for this Owner
Home Financials are based on the most recent Mortgage that was taken out on this home.
Original Mortgage
$84,000
Interest Rate
6.11%
Create a Home Valuation Report for This Property
The Home Valuation Report is an in-depth analysis detailing your home's value as well as a comparison with similar homes in the area
Home Values in the Area
Average Home Value in this Area
Purchase History
| Date | Buyer | Sale Price | Title Company |
|---|---|---|---|
| Ott Jamie | $1,200,000 | None Listed On Document | |
| Gnp1 Llc | -- | None Available | |
| Peluso Giuseppe | $352,000 | -- |
Source: Public Records
Mortgage History
| Date | Status | Borrower | Loan Amount |
|---|---|---|---|
| Previous Owner | Peluso Giuseppe | $84,000 |
Source: Public Records
Tax History Compared to Growth
Tax History
| Year | Tax Paid | Tax Assessment Tax Assessment Total Assessment is a certain percentage of the fair market value that is determined by local assessors to be the total taxable value of land and additions on the property. | Land | Improvement |
|---|---|---|---|---|
| 2025 | $11,364 | $438,100 | $169,200 | $268,900 |
| 2024 | $10,931 | $438,100 | $169,200 | $268,900 |
| 2023 | $10,931 | $438,100 | $169,200 | $268,900 |
| 2022 | $10,681 | $438,100 | $169,200 | $268,900 |
| 2021 | $10,681 | $438,100 | $169,200 | $268,900 |
| 2020 | $10,471 | $438,100 | $169,200 | $268,900 |
| 2019 | $10,278 | $438,100 | $169,200 | $268,900 |
| 2018 | $9,967 | $438,100 | $169,200 | $268,900 |
| 2017 | $9,643 | $438,100 | $169,200 | $268,900 |
| 2016 | $9,511 | $438,100 | $169,200 | $268,900 |
| 2015 | $9,375 | $438,100 | $169,200 | $268,900 |
| 2014 | $9,174 | $438,100 | $169,200 | $268,900 |
Source: Public Records
Map
Nearby Homes
- 2 Edith Ct
- 13 Glutting Place
- 9 Dixon Place
- 10 Ridgedale Ave W
- 48 Grant Ave
- 40 Grant Ave
- 63 Grant Ave
- 574 Ridgedale Ave
- 1 Willow Place
- 5 Raquel Ct
- 38 Klinger Rd
- 16 Jaclyn Dr
- 19 Petry Dr
- 54 Grove Ave
- 8 Eastwood Terrace
- 15 Eastwood Terrace
- 21 Eastwood Terrace
- 13 Eastwood Terrace
- 17 Eastwood Terrace
- 6 Eastwood Terrace