8 Mansfield Ct Mendham, NJ 07945
Estimated Value: $789,332 - $896,000
Studio
--
Bath
2,076
Sq Ft
$409/Sq Ft
Est. Value
About This Home
This home is located at 8 Mansfield Ct, Mendham, NJ 07945 and is currently estimated at $848,833, approximately $408 per square foot. 8 Mansfield Ct is a home located in Morris County with nearby schools including Hilltop Elementary School, Mountain View Middle School, and West Morris Mendham High School.
Ownership History
Date
Name
Owned For
Owner Type
Purchase Details
Closed on
Aug 24, 1996
Sold by
Disabato Joseph A and Disabato Suzanne M
Bought by
Disabato Suzanne M
Current Estimated Value
Create a Home Valuation Report for This Property
The Home Valuation Report is an in-depth analysis detailing your home's value as well as a comparison with similar homes in the area
Home Values in the Area
Average Home Value in this Area
Purchase History
| Date | Buyer | Sale Price | Title Company |
|---|---|---|---|
| Disabato Suzanne M | -- | -- |
Source: Public Records
Tax History
| Year | Tax Paid | Tax Assessment Tax Assessment Total Assessment is a certain percentage of the fair market value that is determined by local assessors to be the total taxable value of land and additions on the property. | Land | Improvement |
|---|---|---|---|---|
| 2025 | $13,053 | $530,600 | $308,500 | $222,100 |
| 2024 | $13,021 | $530,600 | $308,500 | $222,100 |
Source: Public Records
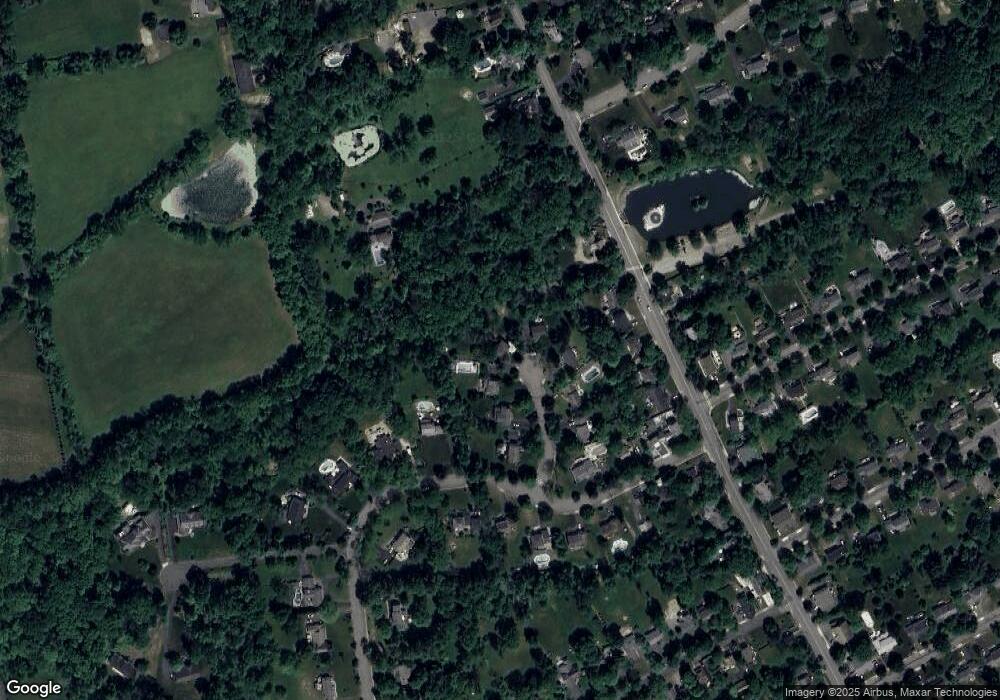
Map
Nearby Homes
- 6 Phoenix Dr
- 40 Mountain Ave
- 211 Mountainside Rd
- 3 Birch St
- 239B Mountainside Rd
- 290 Mountainside Rd
- 48 W Main St
- 3 New St
- 16 Galway Dr
- 5 Calais Rd
- 7 Calais Rd
- 67 Hampshire Dr
- 22 Talmage Rd
- 6 Cold Hill Rd
- 89 Talmage Rd
- 41 Franklin Rd
- 13 Knollwood Trail E
- 465 Cherry Ln
- 559 State Route 24
- 26 Woodland Rd
Your Personal Tour Guide
Ask me questions while you tour the home.