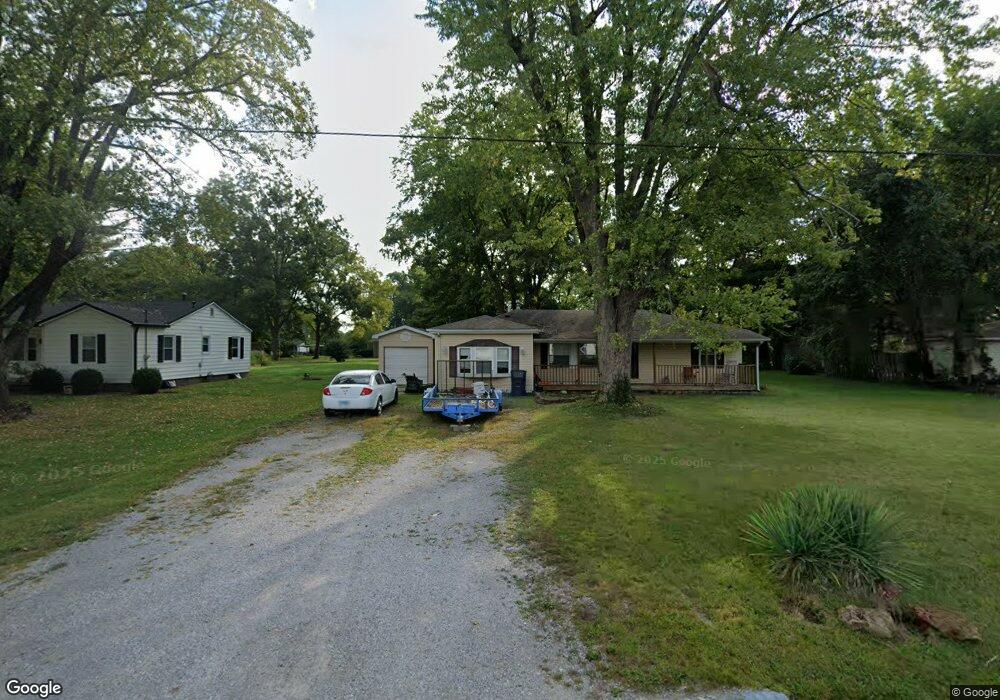
8 Maple Dr Caseyville, IL 62232
Estimated Value: $99,000 - $165,000
Studio
--
Bath
1,264
Sq Ft
$106/Sq Ft
Est. Value
About This Home
This home is located at 8 Maple Dr, Caseyville, IL 62232 and is currently estimated at $134,481, approximately $106 per square foot. 8 Maple Dr is a home located in St. Clair County with nearby schools including Twin Echo Elementary School, Dorris Intermediate School, and Collinsville Middle School.
Ownership History
Date
Name
Owned For
Owner Type
Purchase Details
Closed on
Jun 30, 2022
Sold by
Miller Jamie L
Bought by
Miller Makenzie
Current Estimated Value
Home Financials for this Owner
Home Financials are based on the most recent Mortgage that was taken out on this home.
Original Mortgage
$93,279
Outstanding Balance
$89,051
Interest Rate
5.5%
Mortgage Type
FHA
Estimated Equity
$45,430
Purchase Details
Closed on
May 21, 2018
Sold by
Miller Jamie L
Bought by
Miller Jamie L
Purchase Details
Closed on
Jun 23, 2015
Sold by
Jordan Sharon L
Bought by
Miller Scott A
Purchase Details
Closed on
Mar 16, 2007
Sold by
Jordan Sharon
Bought by
Jordan Sharon L and Sharon L Jordan Revocable Trust
Purchase Details
Closed on
Aug 26, 2003
Sold by
Miller Scott A and Miller Jaime
Bought by
Jordan Sharon
Create a Home Valuation Report for This Property
The Home Valuation Report is an in-depth analysis detailing your home's value as well as a comparison with similar homes in the area
Home Values in the Area
Average Home Value in this Area
Purchase History
| Date | Buyer | Sale Price | Title Company |
|---|---|---|---|
| Miller Makenzie | $95,000 | None Available | |
| Miller Jamie L | -- | Attorney | |
| Miller Scott A | -- | Attorney | |
| Jordan Sharon L | -- | None Available | |
| Jordan Sharon | $68,000 | Abstracts & Titles Inc |
Source: Public Records
Mortgage History
| Date | Status | Borrower | Loan Amount |
|---|---|---|---|
| Open | Miller Makenzie | $93,279 |
Source: Public Records
Tax History
| Year | Tax Paid | Tax Assessment Tax Assessment Total Assessment is a certain percentage of the fair market value that is determined by local assessors to be the total taxable value of land and additions on the property. | Land | Improvement |
|---|---|---|---|---|
| 2024 | $2,088 | $33,589 | $4,742 | $28,847 |
| 2023 | $1,923 | $29,720 | $4,196 | $25,524 |
| 2022 | $1,847 | $28,802 | $4,112 | $24,690 |
| 2021 | $1,796 | $27,337 | $3,903 | $23,434 |
| 2020 | $1,046 | $25,895 | $3,697 | $22,198 |
| 2019 | $848 | $25,895 | $3,697 | $22,198 |
| 2018 | $854 | $26,053 | $3,953 | $22,100 |
| 2017 | $429 | $24,997 | $3,793 | $21,204 |
| 2016 | $880 | $24,432 | $3,707 | $20,725 |
| 2014 | $381 | $22,472 | $2,602 | $19,870 |
| 2013 | $841 | $22,886 | $2,650 | $20,236 |
Source: Public Records
Map
Nearby Homes
- 7919 N Illinois St
- 1159 Peaceful Ln
- 7978 Boreal Ridge
- 0 Walker Meadows Subdivision
- 0 Boreal Ridge Subdivision
- 7751 N Illinois St
- 7745 N Illinois St
- 909 Thornridge Ct
- 8009 Tahoe Ridge Ln
- 8048 Lakeside Dr
- 0 Tahoe Ridge Subdivision
- 1130 Elbow Hill Ct
- 8038 Tahoe Ridge
- 1134 Elbow Hill Ct
- 21 Charles Dr
- 14 Charles Dr
- 12 Charles Dr
- 1014 Otter Lake Ln
- 7903 Walker Meadows Dr
- 1029 Summer Ln
Your Personal Tour Guide
Ask me questions while you tour the home.