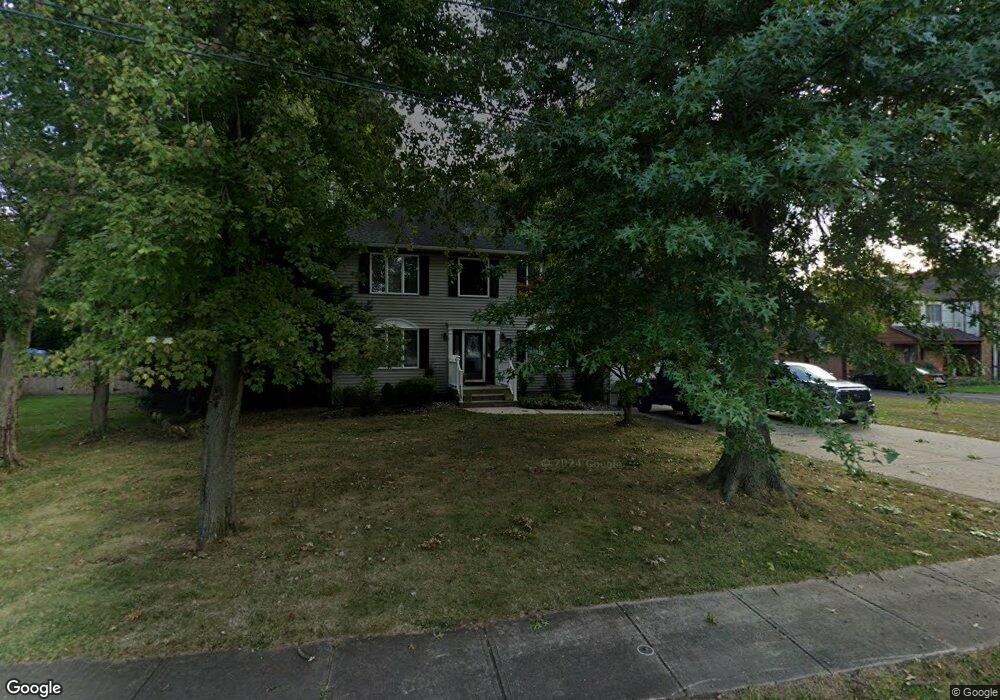
8 Maple St Port Monmouth, NJ 07758
New Monmouth NeighborhoodEstimated Value: $724,000 - $796,000
--
Bed
--
Bath
2,492
Sq Ft
$304/Sq Ft
Est. Value
About This Home
This home is located at 8 Maple St, Port Monmouth, NJ 07758 and is currently estimated at $756,880, approximately $303 per square foot. 8 Maple St is a home located in Monmouth County with nearby schools including Port Monmouth Elementary School, Thorne Middle School, and Middletown High School North.
Ownership History
Date
Name
Owned For
Owner Type
Purchase Details
Closed on
May 11, 2007
Sold by
Traficante Christopher and Traficante Rosanne
Bought by
Sendell Richard L and Sendell Julia H
Current Estimated Value
Home Financials for this Owner
Home Financials are based on the most recent Mortgage that was taken out on this home.
Original Mortgage
$372,000
Outstanding Balance
$226,400
Interest Rate
6.18%
Mortgage Type
Purchase Money Mortgage
Estimated Equity
$530,480
Create a Home Valuation Report for This Property
The Home Valuation Report is an in-depth analysis detailing your home's value as well as a comparison with similar homes in the area
Home Values in the Area
Average Home Value in this Area
Purchase History
| Date | Buyer | Sale Price | Title Company |
|---|---|---|---|
| Sendell Richard L | $465,000 | Transnation Title Ins Co |
Source: Public Records
Mortgage History
| Date | Status | Borrower | Loan Amount |
|---|---|---|---|
| Open | Sendell Richard L | $372,000 |
Source: Public Records
Tax History Compared to Growth
Tax History
| Year | Tax Paid | Tax Assessment Tax Assessment Total Assessment is a certain percentage of the fair market value that is determined by local assessors to be the total taxable value of land and additions on the property. | Land | Improvement |
|---|---|---|---|---|
| 2025 | $9,585 | $648,900 | $324,900 | $324,000 |
| 2024 | $10,068 | $582,700 | $264,600 | $318,100 |
| 2023 | $10,068 | $579,300 | $264,600 | $314,700 |
| 2022 | $9,077 | $512,800 | $213,200 | $299,600 |
| 2021 | $9,077 | $436,400 | $163,100 | $273,300 |
| 2020 | $9,022 | $422,000 | $154,900 | $267,100 |
| 2019 | $8,830 | $418,100 | $149,300 | $268,800 |
| 2018 | $8,332 | $384,500 | $128,200 | $256,300 |
| 2017 | $8,147 | $372,200 | $118,700 | $253,500 |
| 2016 | $7,842 | $368,000 | $132,900 | $235,100 |
| 2015 | $7,841 | $355,300 | $132,900 | $222,400 |
| 2014 | $7,801 | $344,700 | $132,900 | $211,800 |
Source: Public Records
Map
Nearby Homes
- 230 Main St
- 251 Main St Unit AH
- 22 Mills Ave
- 35 Montana Ave
- 9 Brentwood Terrace
- 635 Hudson Ave
- 617 Carter Ave
- 22 Mercer Ave
- 39 Bayberry Ln
- 19 Walada Ave
- 35 Willow St
- 75 Ohio Ave
- 17 Lakeland Dr
- 118 Jersey Ave
- 28 Duchess Ave
- 37 Ohio Ave
- 20 Duchess Ave
- 0 Oregon Ave
- 0 S End Ave Unit 22420779
- 32 Dakota Ave