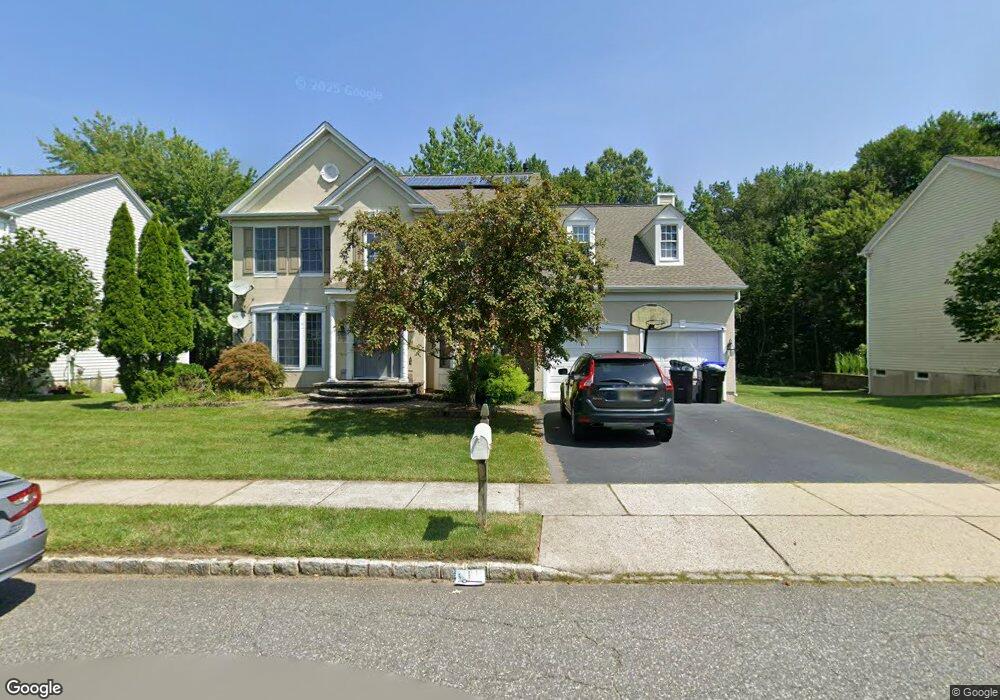
8 Mcginnis St East Brunswick, NJ 08816
Estimated Value: $893,066 - $1,261,000
4
Beds
4
Baths
2,590
Sq Ft
$398/Sq Ft
Est. Value
About This Home
This home is located at 8 Mcginnis St, East Brunswick, NJ 08816 and is currently estimated at $1,032,017, approximately $398 per square foot. 8 Mcginnis St is a home located in Middlesex County with nearby schools including Warnsdorfer Elementary School, Hammarskjold Upper Elementary School, and Churchill Junior High School.
Ownership History
Date
Name
Owned For
Owner Type
Purchase Details
Closed on
Jun 20, 2011
Sold by
Yang Lei and Mak Chiking
Bought by
Karki Trilok S and Joshi Kanchangauri
Current Estimated Value
Home Financials for this Owner
Home Financials are based on the most recent Mortgage that was taken out on this home.
Original Mortgage
$505,600
Outstanding Balance
$348,550
Interest Rate
4.63%
Mortgage Type
New Conventional
Estimated Equity
$683,467
Purchase Details
Closed on
May 30, 2003
Sold by
Hardenburg Realty
Bought by
Pulte Homes Of Nj
Create a Home Valuation Report for This Property
The Home Valuation Report is an in-depth analysis detailing your home's value as well as a comparison with similar homes in the area
Home Values in the Area
Average Home Value in this Area
Purchase History
| Date | Buyer | Sale Price | Title Company |
|---|---|---|---|
| Karki Trilok S | $632,000 | Stewart Title Guaranty Co | |
| Pulte Homes Of Nj | $227,272 | -- |
Source: Public Records
Mortgage History
| Date | Status | Borrower | Loan Amount |
|---|---|---|---|
| Open | Karki Trilok S | $505,600 |
Source: Public Records
Tax History Compared to Growth
Tax History
| Year | Tax Paid | Tax Assessment Tax Assessment Total Assessment is a certain percentage of the fair market value that is determined by local assessors to be the total taxable value of land and additions on the property. | Land | Improvement |
|---|---|---|---|---|
| 2025 | $19,083 | $155,500 | $50,000 | $105,500 |
| 2024 | $18,508 | $155,500 | $50,000 | $105,500 |
| 2023 | $18,508 | $155,500 | $50,000 | $105,500 |
| 2022 | $18,414 | $155,500 | $50,000 | $105,500 |
| 2021 | $17,903 | $155,500 | $50,000 | $105,500 |
| 2020 | $17,890 | $155,500 | $50,000 | $105,500 |
| 2019 | $17,716 | $155,500 | $50,000 | $105,500 |
| 2018 | $17,385 | $155,500 | $50,000 | $105,500 |
| 2017 | $17,061 | $155,500 | $50,000 | $105,500 |
| 2016 | $16,666 | $155,500 | $50,000 | $105,500 |
| 2015 | $16,267 | $155,500 | $50,000 | $105,500 |
| 2014 | $15,920 | $155,500 | $50,000 | $105,500 |
Source: Public Records
Map
Nearby Homes