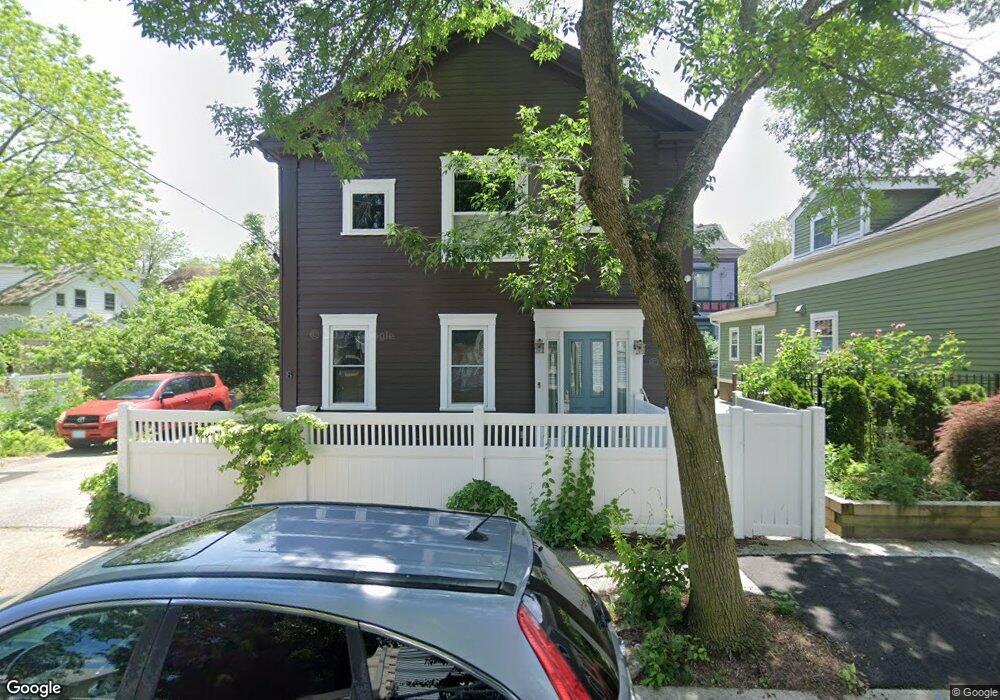
8 Meader St Providence, RI 02909
West End NeighborhoodEstimated Value: $487,000 - $618,000
2
Beds
3
Baths
1,544
Sq Ft
$366/Sq Ft
Est. Value
About This Home
This home is located at 8 Meader St, Providence, RI 02909 and is currently estimated at $565,622, approximately $366 per square foot. 8 Meader St is a home located in Providence County with nearby schools including Paul Cuffee Middle School, Holy Ghost School, and Bradley School—Providence.
Ownership History
Date
Name
Owned For
Owner Type
Purchase Details
Closed on
Jun 25, 2024
Sold by
Motta Elizabeth D
Bought by
Eizabeth D Motta T D and Eizabeth Motta
Current Estimated Value
Purchase Details
Closed on
Jan 19, 1994
Sold by
Paolucci Edmond J
Bought by
Motta Elizabeth D
Create a Home Valuation Report for This Property
The Home Valuation Report is an in-depth analysis detailing your home's value as well as a comparison with similar homes in the area
Home Values in the Area
Average Home Value in this Area
Purchase History
| Date | Buyer | Sale Price | Title Company |
|---|---|---|---|
| Eizabeth D Motta T D | -- | None Available | |
| Eizabeth D Motta T D | -- | None Available | |
| Motta Elizabeth D | $46,000 | -- | |
| Motta Elizabeth D | $46,000 | -- |
Source: Public Records
Mortgage History
| Date | Status | Borrower | Loan Amount |
|---|---|---|---|
| Previous Owner | Motta Elizabeth D | $135,500 | |
| Previous Owner | Motta Elizabeth D | $98,000 | |
| Previous Owner | Motta Elizabeth D | $24,000 |
Source: Public Records
Tax History
| Year | Tax Paid | Tax Assessment Tax Assessment Total Assessment is a certain percentage of the fair market value that is determined by local assessors to be the total taxable value of land and additions on the property. | Land | Improvement |
|---|---|---|---|---|
| 2025 | $4,042 | $481,200 | $262,600 | $218,600 |
| 2024 | $7,779 | $423,900 | $212,100 | $211,800 |
| 2023 | $7,779 | $423,900 | $212,100 | $211,800 |
| 2022 | $7,545 | $423,900 | $212,100 | $211,800 |
| 2021 | $5,833 | $237,500 | $140,100 | $97,400 |
| 2020 | $5,833 | $237,500 | $140,100 | $97,400 |
| 2019 | $5,833 | $237,500 | $140,100 | $97,400 |
| 2018 | $4,583 | $143,400 | $81,000 | $62,400 |
| 2017 | $4,583 | $143,400 | $81,000 | $62,400 |
| 2016 | $4,583 | $143,400 | $81,000 | $62,400 |
| 2015 | $4,664 | $140,900 | $81,000 | $59,900 |
| 2014 | $4,755 | $140,900 | $81,000 | $59,900 |
| 2013 | $4,755 | $140,900 | $81,000 | $59,900 |
Source: Public Records
Map
Nearby Homes
- 10 Slocum St Unit 5
- 1447 Westminster St Unit 1C
- 86 Tobey St
- 498 Broadway
- 103 Almy St
- 1516 Westminster St
- 21 Grant St
- 25 Brighton St
- 107 Ring St
- 44 Sycamore St
- 78 Penn St
- 104 Tell St
- 12 Louisburg Place
- 143 Tell St Unit B
- 102 Vinton St
- 498 Washington St
- 64 Battey St
- 236 Broadway
- 22 Vernon St Unit 22B
- 58 Sutton St Unit 6
Your Personal Tour Guide
Ask me questions while you tour the home.