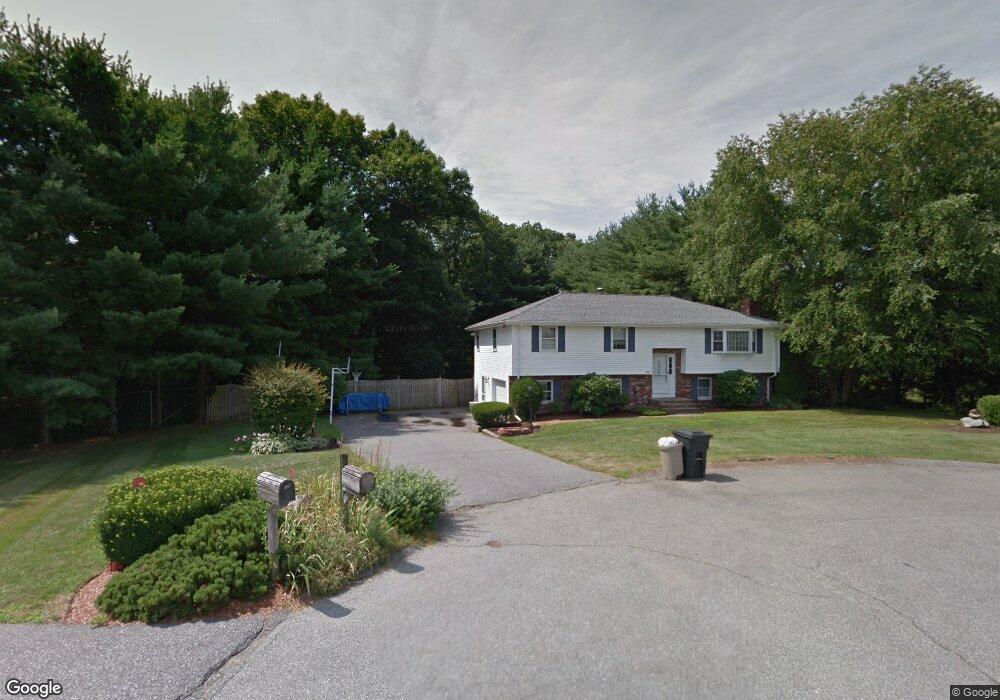
8 Meadow Ln Woburn, MA 01801
Downtown Woburn NeighborhoodEstimated Value: $865,000 - $928,000
3
Beds
2
Baths
1,760
Sq Ft
$511/Sq Ft
Est. Value
About This Home
This home is located at 8 Meadow Ln, Woburn, MA 01801 and is currently estimated at $898,697, approximately $510 per square foot. 8 Meadow Ln is a home located in Middlesex County with nearby schools including Wyman Elementary School, John F. Kennedy Middle School, and Woburn High School.
Ownership History
Date
Name
Owned For
Owner Type
Purchase Details
Closed on
Jun 21, 1996
Sold by
Parajeckas Paul J and Parajeckas Loretta J
Bought by
Moran Christopher L and Moran Diane M
Current Estimated Value
Home Financials for this Owner
Home Financials are based on the most recent Mortgage that was taken out on this home.
Original Mortgage
$170,000
Interest Rate
8.21%
Mortgage Type
Purchase Money Mortgage
Create a Home Valuation Report for This Property
The Home Valuation Report is an in-depth analysis detailing your home's value as well as a comparison with similar homes in the area
Home Values in the Area
Average Home Value in this Area
Purchase History
| Date | Buyer | Sale Price | Title Company |
|---|---|---|---|
| Moran Christopher L | $221,000 | -- |
Source: Public Records
Mortgage History
| Date | Status | Borrower | Loan Amount |
|---|---|---|---|
| Open | Moran Christopher L | $175,000 | |
| Closed | Moran Christopher L | $170,000 | |
| Previous Owner | Moran Christopher L | $137,000 | |
| Previous Owner | Moran Christopher L | $140,000 |
Source: Public Records
Tax History Compared to Growth
Tax History
| Year | Tax Paid | Tax Assessment Tax Assessment Total Assessment is a certain percentage of the fair market value that is determined by local assessors to be the total taxable value of land and additions on the property. | Land | Improvement |
|---|---|---|---|---|
| 2025 | $6,802 | $796,500 | $370,700 | $425,800 |
| 2024 | $6,279 | $779,000 | $353,200 | $425,800 |
| 2023 | $6,073 | $698,000 | $321,100 | $376,900 |
| 2022 | $5,935 | $635,400 | $279,600 | $355,800 |
| 2021 | $10,874 | $608,100 | $266,400 | $341,700 |
| 2020 | $5,462 | $586,100 | $266,400 | $319,700 |
| 2019 | $10,628 | $542,800 | $253,800 | $289,000 |
| 2018 | $4,936 | $499,100 | $233,100 | $266,000 |
| 2017 | $4,871 | $490,000 | $222,100 | $267,900 |
| 2016 | $4,653 | $463,000 | $207,800 | $255,200 |
| 2015 | $4,486 | $441,100 | $194,300 | $246,800 |
| 2014 | $4,269 | $408,900 | $194,300 | $214,600 |
Source: Public Records
Map
Nearby Homes
- 82 Lowell St
- 18 Hamilton Rd
- 4 Ardmore Ave
- 3 Hart St
- 17 Wright St
- 12 Cassidy Dr
- 166 Place Ln Unit 166
- 168 Place Ln
- 29 Overlook Ave
- 37 1/2 Chestnut St
- 8 Clinton St
- 0 Johnson Rd
- 26 Flagg St
- 18 Winn Valley Dr
- 602 Main St Unit 1
- 12 Mishawum Rd
- 16 Sunnyside Rd
- 21 Franklin St
- 14 Church Ave
- 14 Church Ave Unit 2