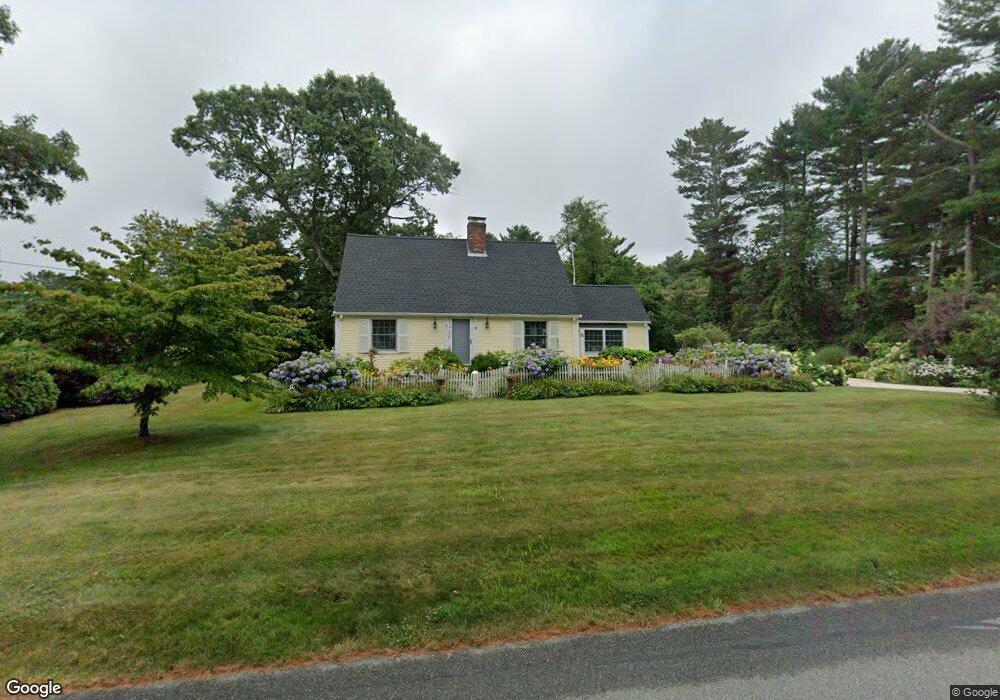
8 Midway Rd Pocasset, MA 02559
Monument Beach NeighborhoodEstimated Value: $611,115 - $813,000
3
Beds
2
Baths
1,501
Sq Ft
$446/Sq Ft
Est. Value
About This Home
This home is located at 8 Midway Rd, Pocasset, MA 02559 and is currently estimated at $670,029, approximately $446 per square foot. 8 Midway Rd is a home located in Barnstable County with nearby schools including Bourne High School, Cadence Academy Preschool - Bourne, and St Margaret Regional School.
Ownership History
Date
Name
Owned For
Owner Type
Purchase Details
Closed on
Apr 18, 2025
Sold by
Reilly Debra A
Bought by
Debra A Reilly 2025 Lt and Reilly
Current Estimated Value
Purchase Details
Closed on
Dec 31, 2002
Sold by
Hegarty Paul E
Bought by
Reilly Debra A
Purchase Details
Closed on
Apr 29, 1999
Sold by
Ward Donald F
Bought by
Hegarty Paul E
Home Financials for this Owner
Home Financials are based on the most recent Mortgage that was taken out on this home.
Original Mortgage
$140,000
Interest Rate
6.95%
Mortgage Type
Purchase Money Mortgage
Purchase Details
Closed on
Dec 1, 1998
Sold by
Hickey Kathleen M and Burns Mary F
Bought by
Ward Donald F and Ward Monique L
Create a Home Valuation Report for This Property
The Home Valuation Report is an in-depth analysis detailing your home's value as well as a comparison with similar homes in the area
Home Values in the Area
Average Home Value in this Area
Purchase History
| Date | Buyer | Sale Price | Title Company |
|---|---|---|---|
| Debra A Reilly 2025 Lt | -- | None Available | |
| Debra A Reilly 2025 Lt | -- | None Available | |
| Reilly Debra A | $276,150 | -- | |
| Reilly Debra A | $276,150 | -- | |
| Hegarty Paul E | $152,000 | -- | |
| Hegarty Paul E | $152,000 | -- | |
| Ward Donald F | $127,000 | -- | |
| Ward Donald F | $127,000 | -- |
Source: Public Records
Mortgage History
| Date | Status | Borrower | Loan Amount |
|---|---|---|---|
| Previous Owner | Ward Donald F | $140,000 |
Source: Public Records
Tax History Compared to Growth
Tax History
| Year | Tax Paid | Tax Assessment Tax Assessment Total Assessment is a certain percentage of the fair market value that is determined by local assessors to be the total taxable value of land and additions on the property. | Land | Improvement |
|---|---|---|---|---|
| 2025 | $3,913 | $501,000 | $211,400 | $289,600 |
| 2024 | $3,854 | $480,600 | $201,300 | $279,300 |
| 2023 | $3,748 | $425,400 | $178,200 | $247,200 |
| 2022 | $3,570 | $353,800 | $157,700 | $196,100 |
| 2021 | $3,469 | $322,100 | $143,500 | $178,600 |
| 2020 | $3,278 | $305,200 | $142,100 | $163,100 |
| 2019 | $3,112 | $296,100 | $142,100 | $154,000 |
| 2018 | $2,972 | $282,000 | $135,400 | $146,600 |
| 2017 | $2,618 | $254,200 | $127,400 | $126,800 |
| 2016 | $2,557 | $251,700 | $127,400 | $124,300 |
| 2015 | $2,400 | $238,300 | $114,000 | $124,300 |
Source: Public Records
Map
Nearby Homes
- 566 Shore Rd
- 515 County Rd
- 18 Douglas Ave
- 39 Bennets Neck Dr
- 30 Howard Ave
- 14 Navajo Rd
- 18 Carlton Rd
- 93 Valley Bars Rd
- 105 Clay Pond Rd
- 709 County Rd
- 254 Barlows Landing Rd
- 174 Barlows Landing Rd
- 940 County Rd
- 12 Beachwood Rd
- 70 Wings Neck Rd
- 15 1st St
- 2 Westerly Dr
- 24 Richmond Rd
- 7 4th Ave
- 7 Portside Dr