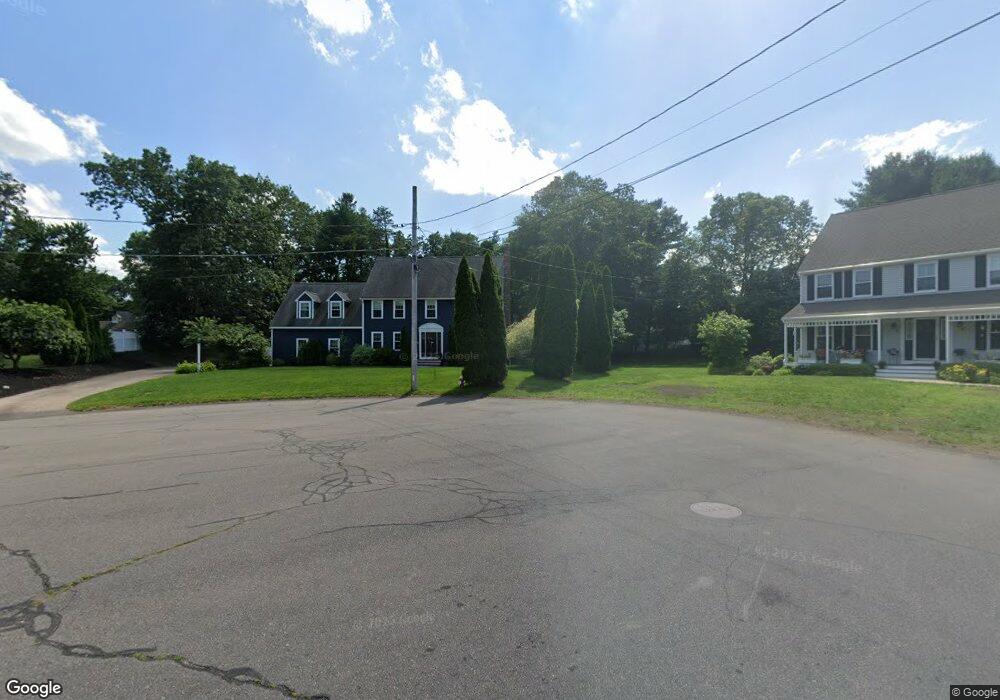
8 Mockingbird Ln Walpole, MA 02081
Estimated Value: $926,000 - $1,124,889
5
Beds
3
Baths
3,161
Sq Ft
$330/Sq Ft
Est. Value
About This Home
This home is located at 8 Mockingbird Ln, Walpole, MA 02081 and is currently estimated at $1,042,222, approximately $329 per square foot. 8 Mockingbird Ln is a home located in Norfolk County with nearby schools including Elm Street School, Eleanor N. Johnson Middle School, and Walpole High School.
Ownership History
Date
Name
Owned For
Owner Type
Purchase Details
Closed on
Aug 19, 2016
Sold by
Hayward Sean P
Bought by
Hayward Sean P and Hayward Jillian M
Current Estimated Value
Purchase Details
Closed on
Sep 11, 2015
Sold by
Household Finance Corp
Bought by
Hayward Sean
Home Financials for this Owner
Home Financials are based on the most recent Mortgage that was taken out on this home.
Original Mortgage
$401,280
Interest Rate
4.01%
Mortgage Type
New Conventional
Purchase Details
Closed on
Jun 30, 2015
Sold by
Challis Steven J and Challis Susan L
Bought by
Household Finance Corp
Purchase Details
Closed on
Jun 1, 1989
Sold by
T&T Homes Inc
Bought by
Challis Steven J
Create a Home Valuation Report for This Property
The Home Valuation Report is an in-depth analysis detailing your home's value as well as a comparison with similar homes in the area
Home Values in the Area
Average Home Value in this Area
Purchase History
| Date | Buyer | Sale Price | Title Company |
|---|---|---|---|
| Hayward Sean P | -- | -- | |
| Hayward Sean | $501,899 | -- | |
| Household Finance Corp | $600,244 | -- | |
| Challis Steven J | $305,000 | -- |
Source: Public Records
Mortgage History
| Date | Status | Borrower | Loan Amount |
|---|---|---|---|
| Previous Owner | Hayward Sean | $401,280 | |
| Previous Owner | Challis Steven J | $100,000 |
Source: Public Records
Tax History
| Year | Tax Paid | Tax Assessment Tax Assessment Total Assessment is a certain percentage of the fair market value that is determined by local assessors to be the total taxable value of land and additions on the property. | Land | Improvement |
|---|---|---|---|---|
| 2025 | $13,103 | $1,021,300 | $373,300 | $648,000 |
| 2024 | $12,636 | $955,800 | $358,900 | $596,900 |
| 2023 | $11,943 | $859,800 | $312,200 | $547,600 |
| 2022 | $11,149 | $771,000 | $289,000 | $482,000 |
| 2021 | $10,976 | $739,600 | $272,700 | $466,900 |
| 2020 | $10,381 | $692,500 | $257,300 | $435,200 |
| 2019 | $10,040 | $664,900 | $247,200 | $417,700 |
| 2018 | $10,037 | $657,300 | $238,000 | $419,300 |
| 2017 | $9,632 | $628,300 | $228,800 | $399,500 |
| 2016 | $8,781 | $564,300 | $213,300 | $351,000 |
| 2015 | $8,447 | $538,000 | $203,200 | $334,800 |
| 2014 | $8,627 | $547,400 | $203,200 | $344,200 |
Source: Public Records
Map
Nearby Homes
- 1391 Main St Unit 308
- 1391 Main St Unit 306
- 1391 Main St Unit 304
- 9 Pearl St
- 145 South St Unit 5
- 1110 Main St
- 10 Sandtrap Cir Unit 2
- 31 Sandtrap Cir Unit 500
- 13 Sandtrap Cir Unit 14
- 11 Sandtrap Cir Unit 15
- 20 Sandtrap Cir Unit 4
- 19 Sandtrap Cir Unit 11
- 18 Sandtrap Cir Unit 3
- 17 Sandtrap Cir Unit 12
- 15 Sandtrap Cir Unit 13
- 10 Weathervane Dr Unit 20
- 3 Weathervane Dr Unit 1
- 25 Sandtrap Cir Unit 8
- 29 Sandtrap Cir Unit 6
- 27 Sandtrap Cir Unit 7
Your Personal Tour Guide
Ask me questions while you tour the home.