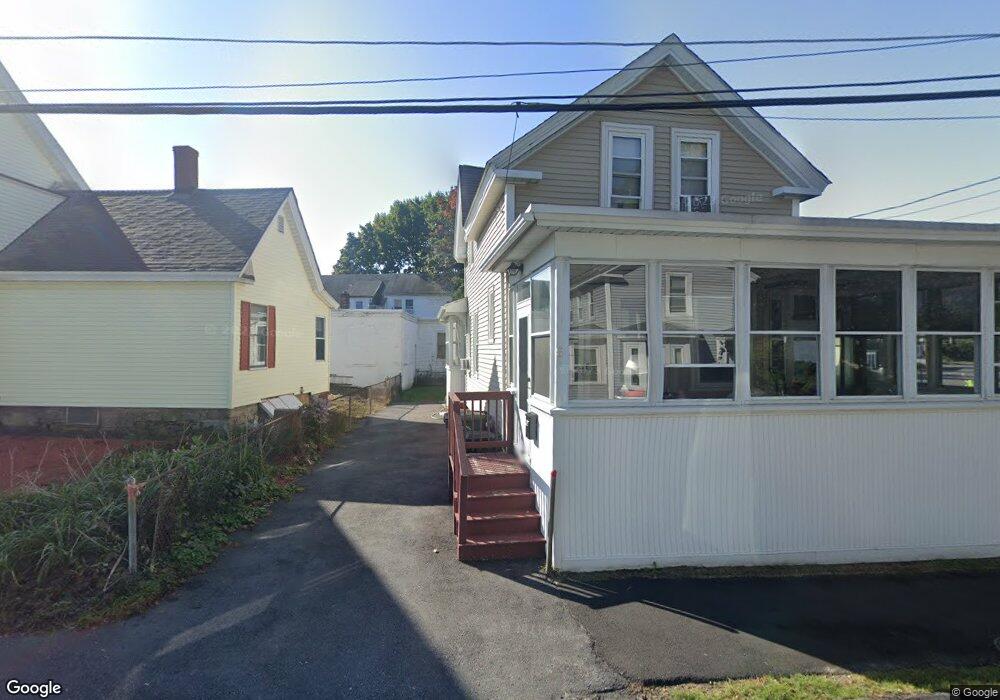
8 Morton St North Andover, MA 01845
Estimated Value: $529,000 - $561,000
3
Beds
2
Baths
1,395
Sq Ft
$391/Sq Ft
Est. Value
About This Home
This home is located at 8 Morton St, North Andover, MA 01845 and is currently estimated at $545,983, approximately $391 per square foot. 8 Morton St is a home located in Essex County with nearby schools including Thomson Elementary School, North Andover Middle School, and North Andover High School.
Ownership History
Date
Name
Owned For
Owner Type
Purchase Details
Closed on
Mar 19, 2021
Sold by
Voisine Maureen E
Bought by
Maurren E Voisine Ret
Current Estimated Value
Purchase Details
Closed on
Jan 1, 1964
Bought by
Voisine Peter G and Voisine Maureen E
Create a Home Valuation Report for This Property
The Home Valuation Report is an in-depth analysis detailing your home's value as well as a comparison with similar homes in the area
Home Values in the Area
Average Home Value in this Area
Purchase History
| Date | Buyer | Sale Price | Title Company |
|---|---|---|---|
| Maurren E Voisine Ret | -- | None Available | |
| Voisine Peter G | -- | -- |
Source: Public Records
Mortgage History
| Date | Status | Borrower | Loan Amount |
|---|---|---|---|
| Previous Owner | Voisine Peter G | $50,000 | |
| Previous Owner | Voisine Peter G | $50,000 | |
| Previous Owner | Voisine Peter G | $50,000 | |
| Previous Owner | Voisine Peter G | $100,000 |
Source: Public Records
Tax History
| Year | Tax Paid | Tax Assessment Tax Assessment Total Assessment is a certain percentage of the fair market value that is determined by local assessors to be the total taxable value of land and additions on the property. | Land | Improvement |
|---|---|---|---|---|
| 2025 | $5,001 | $444,100 | $225,300 | $218,800 |
| 2024 | $4,837 | $436,200 | $223,600 | $212,600 |
| 2023 | $4,908 | $401,000 | $220,300 | $180,700 |
| 2022 | $4,876 | $360,400 | $200,200 | $160,200 |
| 2021 | $4,646 | $327,900 | $180,200 | $147,700 |
| 2020 | $4,391 | $319,600 | $171,900 | $147,700 |
| 2019 | $4,463 | $332,800 | $171,900 | $160,900 |
| 2018 | $4,836 | $332,800 | $171,900 | $160,900 |
| 2017 | $3,730 | $261,200 | $119,600 | $141,600 |
| 2016 | $3,774 | $264,500 | $119,600 | $144,900 |
| 2015 | $3,533 | $245,500 | $122,600 | $122,900 |
Source: Public Records
Map
Nearby Homes
- 94 Main St
- 28 Patriot St
- 148 Main St Unit F442
- 70-72 Maple Ave Unit 3
- 86 Maple Ave Unit 88
- 100 Union St
- 219 Waverley Rd
- 27 Woodland Ct
- 7 Stevens Ct
- 52 Howard St
- 129 Moody St
- 41 Lyman Rd
- 118 Prescott St
- 2 Cherry St
- 95 Colgate Dr
- 37 Lincoln St Unit 39
- 350 Greene St Unit 410
- 350 Greene St Unit 305
- 91-93 Andover St
- 119 Andover St
Your Personal Tour Guide
Ask me questions while you tour the home.