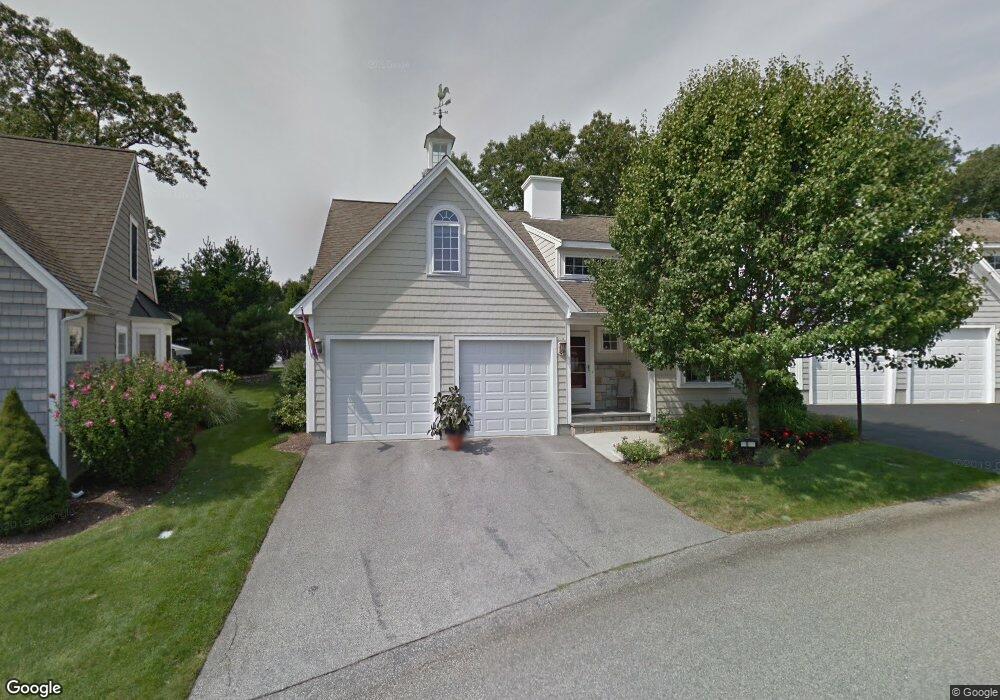
8 Mulligan Dr South Weymouth, MA 02190
South Weymouth NeighborhoodEstimated Value: $902,000 - $969,229
2
Beds
3
Baths
2,116
Sq Ft
$444/Sq Ft
Est. Value
About This Home
This home is located at 8 Mulligan Dr, South Weymouth, MA 02190 and is currently estimated at $939,057, approximately $443 per square foot. 8 Mulligan Dr is a home located in Norfolk County with nearby schools including Thomas W. Hamilton Primary School, Abigail Adams Middle School, and Weymouth Middle School Chapman.
Ownership History
Date
Name
Owned For
Owner Type
Purchase Details
Closed on
Oct 29, 2004
Sold by
Weathervane Dev Corp
Bought by
Tardanico Diana S and Tardanico Philip A
Current Estimated Value
Home Financials for this Owner
Home Financials are based on the most recent Mortgage that was taken out on this home.
Original Mortgage
$190,000
Outstanding Balance
$94,563
Interest Rate
5.74%
Mortgage Type
Purchase Money Mortgage
Estimated Equity
$844,494
Create a Home Valuation Report for This Property
The Home Valuation Report is an in-depth analysis detailing your home's value as well as a comparison with similar homes in the area
Home Values in the Area
Average Home Value in this Area
Purchase History
| Date | Buyer | Sale Price | Title Company |
|---|---|---|---|
| Tardanico Diana S | $484,650 | -- |
Source: Public Records
Mortgage History
| Date | Status | Borrower | Loan Amount |
|---|---|---|---|
| Open | Tardanico Diana S | $190,000 |
Source: Public Records
Tax History Compared to Growth
Tax History
| Year | Tax Paid | Tax Assessment Tax Assessment Total Assessment is a certain percentage of the fair market value that is determined by local assessors to be the total taxable value of land and additions on the property. | Land | Improvement |
|---|---|---|---|---|
| 2025 | $8,889 | $880,100 | $0 | $880,100 |
| 2024 | $8,638 | $841,100 | $0 | $841,100 |
| 2023 | $7,573 | $724,700 | $0 | $724,700 |
| 2022 | $7,583 | $661,700 | $0 | $661,700 |
| 2021 | $7,438 | $633,600 | $0 | $633,600 |
| 2020 | $7,257 | $608,800 | $0 | $608,800 |
| 2019 | $6,994 | $577,100 | $0 | $577,100 |
| 2018 | $6,766 | $541,300 | $0 | $541,300 |
| 2017 | $6,810 | $531,600 | $0 | $531,600 |
| 2016 | $6,671 | $521,200 | $0 | $521,200 |
| 2015 | $6,422 | $497,800 | $0 | $497,800 |
| 2014 | $6,516 | $489,900 | $0 | $489,900 |
Source: Public Records
Map
Nearby Homes
- 221 Sandtrap Cir
- 10 Mulligan Dr
- 7 Mulligan Dr
- 25 Sandtrap Cir
- 16 Mulligan Dr
- 227 Sandtrap Cir
- 17 Mulligan Dr
- 17 Mulligan Dr Unit 17
- 207 Sandtrap Cir
- 218 Sandtrap Cir
- 20 Mulligan Dr
- 226 Sandtrap Cir Unit 118
- 226 Sandtrap Cir
- 33 Sandtrap Cir
- 212 Sandtrap Cir
- 23 Mulligan Dr
- 205 Sandtrap Cir
- 205 Sandtrap Cir Unit 205
- 24 Mulligan Dr
- 39 Sandtrap Cir