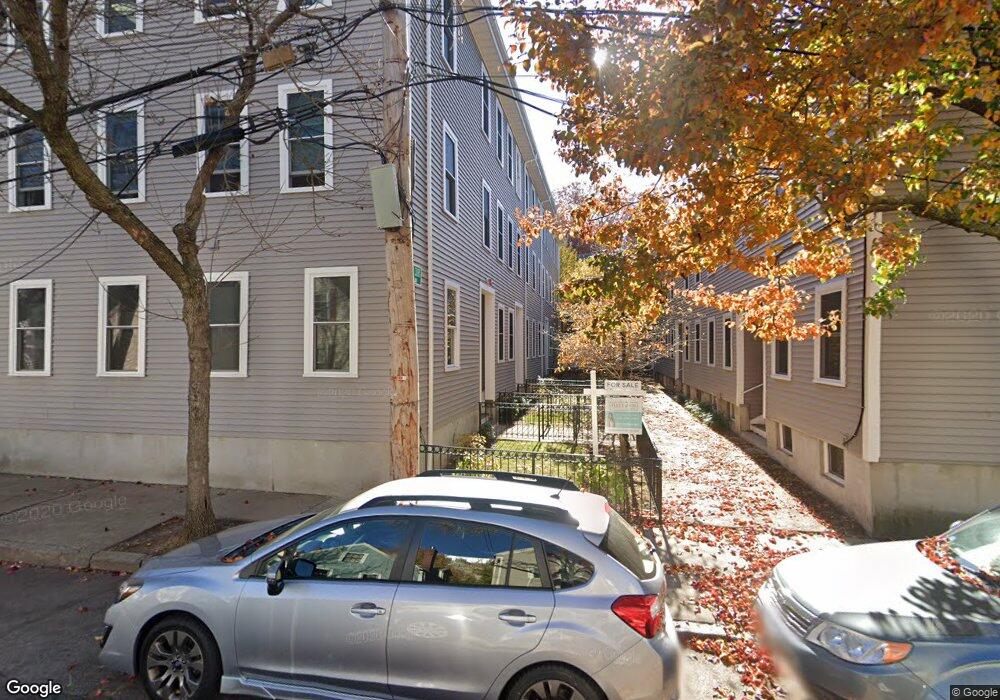
8 Mullins Ct Unit B Cambridge, MA 02141
East Cambridge NeighborhoodEstimated Value: $658,000 - $746,000
2
Beds
1
Bath
731
Sq Ft
$970/Sq Ft
Est. Value
About This Home
This home is located at 8 Mullins Ct Unit B, Cambridge, MA 02141 and is currently estimated at $709,300, approximately $970 per square foot. 8 Mullins Ct Unit B is a home located in Middlesex County with nearby schools including Community Charter School of Cambridge and Torit Montessori School.
Ownership History
Date
Name
Owned For
Owner Type
Purchase Details
Closed on
Aug 17, 2021
Sold by
Calleja Leon R
Bought by
Danielsen-Haces Alexander
Current Estimated Value
Home Financials for this Owner
Home Financials are based on the most recent Mortgage that was taken out on this home.
Original Mortgage
$542,000
Outstanding Balance
$492,846
Interest Rate
2.9%
Mortgage Type
Purchase Money Mortgage
Estimated Equity
$216,454
Purchase Details
Closed on
Apr 21, 2016
Sold by
Calleja Amos B
Bought by
Calleja Leon R
Purchase Details
Closed on
Jun 25, 2004
Sold by
Steinbergh Alex M and Stanley Bowden R
Bought by
Calleja Amos B and Calleja Leon
Home Financials for this Owner
Home Financials are based on the most recent Mortgage that was taken out on this home.
Original Mortgage
$263,900
Interest Rate
6.32%
Mortgage Type
Purchase Money Mortgage
Create a Home Valuation Report for This Property
The Home Valuation Report is an in-depth analysis detailing your home's value as well as a comparison with similar homes in the area
Home Values in the Area
Average Home Value in this Area
Purchase History
| Date | Buyer | Sale Price | Title Company |
|---|---|---|---|
| Danielsen-Haces Alexander | $650,000 | None Available | |
| Danielsen-Haces Alexander | $650,000 | None Available | |
| Calleja Leon R | -- | -- | |
| Calleja Leon R | -- | -- | |
| Calleja Amos B | $329,900 | -- | |
| Calleja Amos B | $329,900 | -- |
Source: Public Records
Mortgage History
| Date | Status | Borrower | Loan Amount |
|---|---|---|---|
| Open | Danielsen-Haces Alexander | $542,000 | |
| Closed | Danielsen-Haces Alexander | $542,000 | |
| Previous Owner | Calleja Amos B | $263,900 |
Source: Public Records
Tax History Compared to Growth
Tax History
| Year | Tax Paid | Tax Assessment Tax Assessment Total Assessment is a certain percentage of the fair market value that is determined by local assessors to be the total taxable value of land and additions on the property. | Land | Improvement |
|---|---|---|---|---|
| 2025 | $3,805 | $599,200 | $0 | $599,200 |
| 2024 | $3,450 | $582,700 | $0 | $582,700 |
| 2023 | $3,467 | $591,700 | $0 | $591,700 |
| 2022 | $3,384 | $571,600 | $0 | $571,600 |
| 2021 | $3,272 | $559,300 | $0 | $559,300 |
| 2020 | $3,177 | $552,500 | $0 | $552,500 |
| 2019 | $3,042 | $512,100 | $0 | $512,100 |
| 2018 | $3,022 | $469,400 | $0 | $469,400 |
| 2017 | $2,789 | $429,700 | $0 | $429,700 |
| 2016 | $2,642 | $378,000 | $0 | $378,000 |
| 2015 | -- | $330,800 | $0 | $330,800 |
| 2014 | $2,491 | $297,200 | $0 | $297,200 |
Source: Public Records
Map
Nearby Homes
- 36 Sciarappa St
- 68 Gore St
- 170 Gore St Unit 502
- 170 Gore St Unit 113
- 25 6th St
- 76-78 Thorndike St
- 59 7th St Unit 2
- 59 7th St Unit 1
- 59 7th St Unit 3
- 30 2nd St Unit 2
- 30 2nd St Unit 1
- 30 2nd St Unit 1 & 2
- 50 Spring St
- 17 Otis St Unit 602
- 9 Medford St Unit 3
- 133 Charles St Unit 133
- 71 Fulkerson St Unit 206
- 95 2nd St Unit 3
- 1 Marion St Unit 1
- 1 Marion St Unit 6,7
- 8 Mullins Ct Unit C
- 8 Mullins Ct Unit A
- 8 Mullins Ct Unit 3
- 8 Mullins Ct Unit 8B
- 8 Mullins Ct Unit 1
- 1 Mullins Ct Unit 6
- 1 Mullins Ct Unit 5
- 1 Mullins Ct Unit 4
- 1 Mullins Ct Unit 3
- 1 Mullins Ct Unit 2
- 1 Mullins Ct
- 1 Mullins Ct Unit 1
- 7 Mullins Ct Unit C
- 7 Mullins Ct Unit B
- 7 Mullins Ct Unit A
- 7 Mullins Ct Unit 2
- 7 Mullins Ct Unit 1
- 7 Mullins Ct Unit 2B
- 3 Mullins Ct Unit 3
- 9 Mullins Ct Unit 2B