8 Murray Ave Unit 10 Burlington, MA 01803
North Burlington NeighborhoodEstimated Value: $847,000 - $882,000
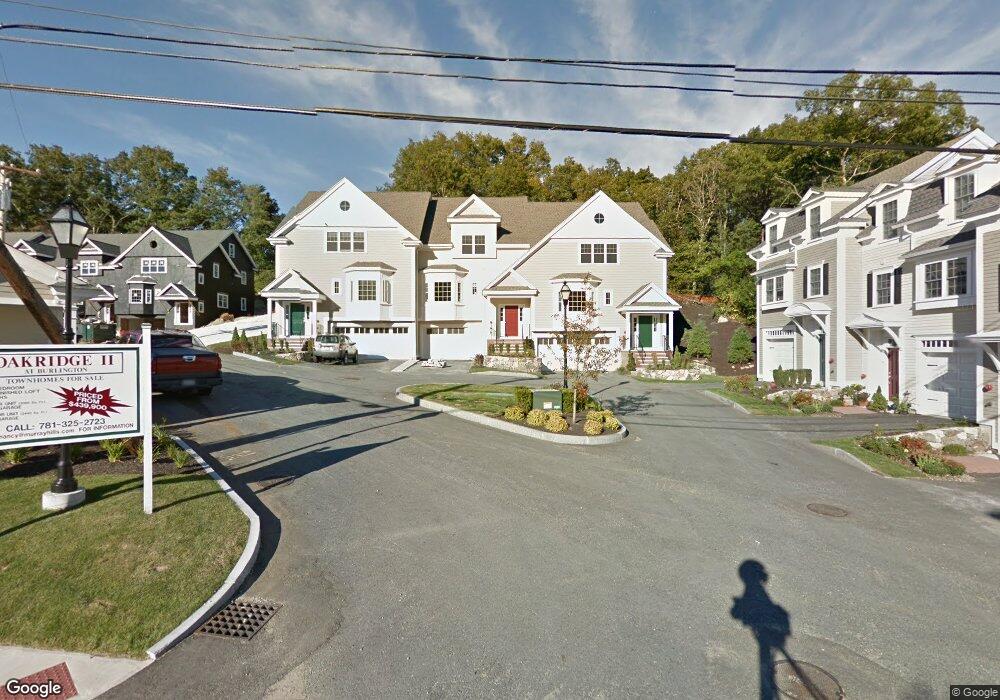
About This Home
This ultra elegant sunny and spacious 3 level, 2-3 bedroom, 3.5 bath townhouse is packed with magnificent and state of the art features including granite counters in the kitchens and baths, recessed lighting, an elegant gas fireplace in the living room, splendid bay windows in the sunny breakfast nook, oversized walk in closets, jacuzzi tub and shower in the master bath, 2 car garage (under), enormous 3rd floor loft with private bath (can function as 3rd bedroom, private guest suite, office or playroom), private brick-paved back patio and so much more! Located in a commuters dream minutes from 128 and Rt 3 & a myriad of fantastic restaurants and shops in North Burlington. Association fees will be paid by the owner and covers landscaping and snow removal including driveways and up to front door. Owner pays HOA fee, water and sewer. HOA fee covers trash, landscaping and snow removal. Tenant pays for gas and electric.
Ownership History
Purchase Details
Home Financials for this Owner
Home Financials are based on the most recent Mortgage that was taken out on this home.Home Values in the Area
Average Home Value in this Area
Purchase History
| Date | Buyer | Sale Price | Title Company |
|---|---|---|---|
| Lin Chia Warren W | $491,000 | -- | |
| Lin Chia Warren W | $491,000 | -- |
Mortgage History
| Date | Status | Borrower | Loan Amount |
|---|---|---|---|
| Open | Lin Chia Warren W | $392,800 | |
| Closed | Lin Chia Warren W | $392,800 |
Property History
| Date | Event | Price | List to Sale | Price per Sq Ft |
|---|---|---|---|---|
| 07/23/2025 07/23/25 | Off Market | $4,700 | -- | -- |
| 07/01/2025 07/01/25 | For Rent | $4,700 | -- | -- |
Tax History
| Year | Tax Paid | Tax Assessment Tax Assessment Total Assessment is a certain percentage of the fair market value that is determined by local assessors to be the total taxable value of land and additions on the property. | Land | Improvement |
|---|---|---|---|---|
| 2025 | $6,878 | $794,200 | $0 | $794,200 |
| 2024 | $7,145 | $799,200 | $0 | $799,200 |
| 2023 | $6,477 | $689,000 | $0 | $689,000 |
| 2022 | $6,572 | $660,500 | $0 | $660,500 |
| 2021 | $6,835 | $686,900 | $0 | $686,900 |
| 2020 | $5,603 | $581,200 | $0 | $581,200 |
| 2019 | $5,321 | $507,700 | $0 | $507,700 |
| 2018 | $5,392 | $507,700 | $0 | $507,700 |
| 2017 | $4,919 | $507,700 | $0 | $507,700 |
| 2016 | $5,097 | $444,800 | $0 | $444,800 |
| 2015 | $5,048 | $444,800 | $0 | $444,800 |
Map
- 12 Murray Ave Unit 18
- 27 Purity Springs Rd
- 1 Joanne Rd
- 345 Cambridge St
- 21 Meadowvale Rd
- 23 Wilmington Rd
- 5 Porter Ave
- 23 Rocky Hill Rd
- 210 Winn St
- 23 County Rd
- 29 Beaverbrook Rd
- 155 Mill St
- 13 Wing Terrace
- 55 Francis Wyman Rd
- 0 Bedford St
- 1 Highland Way
- 12 Pleasant St
- 11 Town Line Rd
- 4 Hallmark Gardens Unit 2
- 4 Colburn St
- 8 Murray Ave
- 8 Murray Ave Unit 12
- 8 Murray Ave Unit 11
- 6 Murray Ave Unit 8
- 6 Murray Ave Unit 7
- 6 Murray Ave Unit 9
- 4 Murray Ave Unit 5
- 4 Murray Ave Unit 4
- 4 Murray Ave Unit 6
- 32 Maryvale Rd
- 10 Skilton Ln
- 10 Murray Ave Unit 13
- 12 Murray Ave
- 30 Maryvale Rd
- 12 Skilton Ln
- 29 Maryvale Rd
- 28 Maryvale Rd
- 9 Scott Ave
- 7 Skilton Ln
- 15 Taylor Ave
Ask me questions while you tour the home.