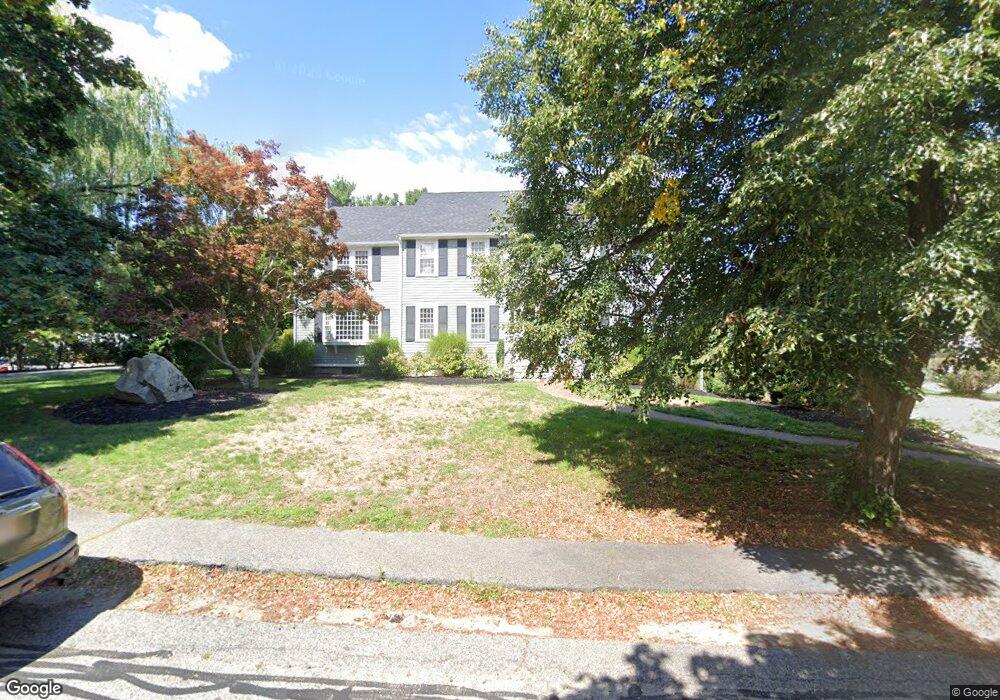
8 Myers Farm Rd Hingham, MA 02043
Estimated Value: $1,910,000 - $2,080,000
5
Beds
3
Baths
2,952
Sq Ft
$678/Sq Ft
Est. Value
About This Home
This home is located at 8 Myers Farm Rd, Hingham, MA 02043 and is currently estimated at $2,000,324, approximately $677 per square foot. 8 Myers Farm Rd is a home located in Plymouth County with nearby schools including Plymouth River Elementary School, South Shore Conservatory of Music Preschool, and St. Paul Elementary School.
Ownership History
Date
Name
Owned For
Owner Type
Purchase Details
Closed on
Apr 15, 2025
Sold by
Drinkwater-Montes Carrie and Montes Edward
Bought by
Smith Molly and Mcauliffe Lawrence
Current Estimated Value
Home Financials for this Owner
Home Financials are based on the most recent Mortgage that was taken out on this home.
Original Mortgage
$1,574,250
Outstanding Balance
$1,564,619
Interest Rate
6.76%
Mortgage Type
Purchase Money Mortgage
Estimated Equity
$435,705
Purchase Details
Closed on
May 25, 2010
Sold by
Drinkwater Carrie B
Bought by
Drinkwater Carrie B and Montes Edward
Purchase Details
Closed on
Mar 17, 2010
Sold by
Drinkwater Jeffrey C
Bought by
Drinkwater Carrie B
Purchase Details
Closed on
May 12, 2006
Sold by
Melia Arthur J and Melia Constance M
Bought by
Drinkwater Jeffrey C and Drinkwater Carrie B
Create a Home Valuation Report for This Property
The Home Valuation Report is an in-depth analysis detailing your home's value as well as a comparison with similar homes in the area
Home Values in the Area
Average Home Value in this Area
Purchase History
| Date | Buyer | Sale Price | Title Company |
|---|---|---|---|
| Smith Molly | $2,099,000 | None Available | |
| Smith Molly | $2,099,000 | None Available | |
| Drinkwater Carrie B | -- | -- | |
| Drinkwater Carrie B | -- | -- | |
| Drinkwater Carrie B | -- | -- | |
| Drinkwater Carrie B | -- | -- | |
| Drinkwater Carrie B | -- | -- | |
| Drinkwater Jeffrey C | $880,000 | -- | |
| Drinkwater Jeffrey C | $880,000 | -- |
Source: Public Records
Mortgage History
| Date | Status | Borrower | Loan Amount |
|---|---|---|---|
| Open | Smith Molly | $1,574,250 | |
| Closed | Smith Molly | $1,574,250 | |
| Previous Owner | Drinkwater Jeffrey C | $585,000 |
Source: Public Records
Tax History Compared to Growth
Tax History
| Year | Tax Paid | Tax Assessment Tax Assessment Total Assessment is a certain percentage of the fair market value that is determined by local assessors to be the total taxable value of land and additions on the property. | Land | Improvement |
|---|---|---|---|---|
| 2025 | $17,687 | $1,654,500 | $576,000 | $1,078,500 |
| 2024 | $16,965 | $1,563,600 | $576,000 | $987,600 |
| 2023 | $14,172 | $1,417,200 | $504,000 | $913,200 |
| 2022 | $12,944 | $1,119,700 | $400,000 | $719,700 |
| 2021 | $13,275 | $1,125,000 | $460,000 | $665,000 |
| 2020 | $12,971 | $1,125,000 | $460,000 | $665,000 |
| 2019 | $12,793 | $1,083,200 | $460,000 | $623,200 |
| 2018 | $12,749 | $1,083,200 | $460,000 | $623,200 |
| 2017 | $12,150 | $991,800 | $460,000 | $531,800 |
| 2016 | $12,115 | $970,000 | $438,200 | $531,800 |
| 2015 | $11,895 | $949,300 | $417,500 | $531,800 |
Source: Public Records
Map
Nearby Homes