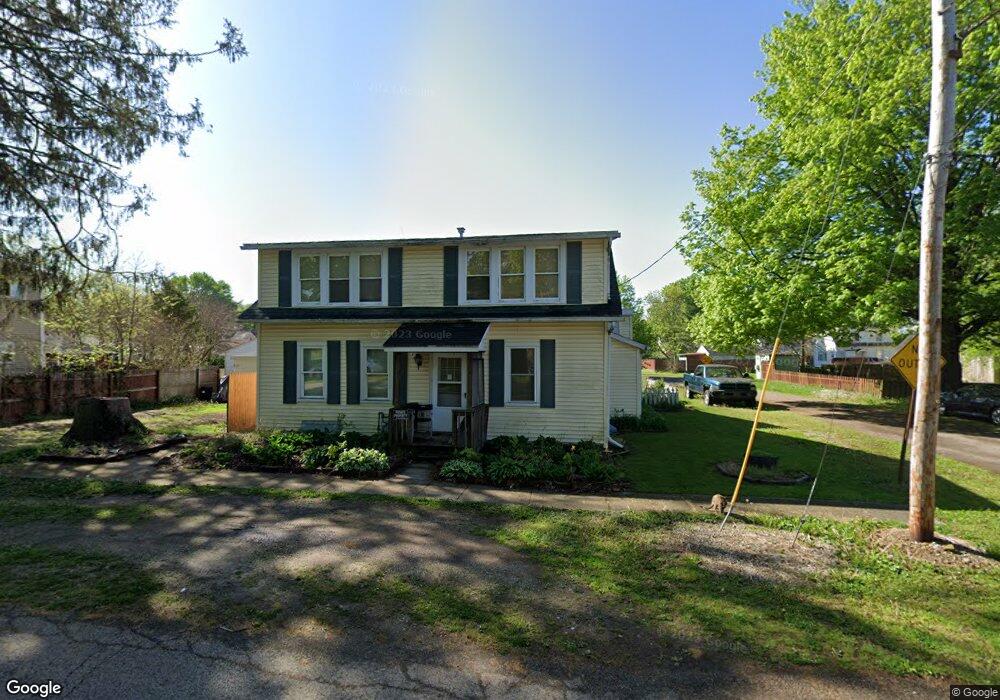
8 N Monroe St Mount Vernon, OH 43050
Estimated Value: $144,000 - $181,000
3
Beds
2
Baths
1,504
Sq Ft
$110/Sq Ft
Est. Value
About This Home
This home is located at 8 N Monroe St, Mount Vernon, OH 43050 and is currently estimated at $165,480, approximately $110 per square foot. 8 N Monroe St is a home located in Knox County with nearby schools including Mount Vernon High School, St. Vincent de Paul School, and Christian Star Academy.
Ownership History
Date
Name
Owned For
Owner Type
Purchase Details
Closed on
Jan 26, 2017
Sold by
Reed Elmer W
Bought by
Calkins Douglas A and Calkins Kathy J
Current Estimated Value
Home Financials for this Owner
Home Financials are based on the most recent Mortgage that was taken out on this home.
Original Mortgage
$75,757
Outstanding Balance
$62,653
Interest Rate
4.16%
Mortgage Type
New Conventional
Estimated Equity
$102,827
Purchase Details
Closed on
Apr 2, 2004
Sold by
Reed Elmer W and Reed Elizabeth
Bought by
Reed Elmer W
Purchase Details
Closed on
Apr 12, 2000
Sold by
Pettit Debra S
Bought by
Reed Elmer W and Reed Elizabeth
Purchase Details
Closed on
Jan 30, 1992
Sold by
Harpst John D
Bought by
Pettit Debra S
Purchase Details
Closed on
Aug 9, 1989
Sold by
Moxley Donald R and Moxley Sarah A
Bought by
Harpst John D
Create a Home Valuation Report for This Property
The Home Valuation Report is an in-depth analysis detailing your home's value as well as a comparison with similar homes in the area
Home Values in the Area
Average Home Value in this Area
Purchase History
| Date | Buyer | Sale Price | Title Company |
|---|---|---|---|
| Calkins Douglas A | $75,000 | None Available | |
| Reed Elmer W | -- | -- | |
| Reed Elmer W | $46,200 | -- | |
| Pettit Debra S | $18,400 | -- | |
| Harpst John D | $13,500 | -- |
Source: Public Records
Mortgage History
| Date | Status | Borrower | Loan Amount |
|---|---|---|---|
| Open | Calkins Douglas A | $75,757 |
Source: Public Records
Tax History Compared to Growth
Tax History
| Year | Tax Paid | Tax Assessment Tax Assessment Total Assessment is a certain percentage of the fair market value that is determined by local assessors to be the total taxable value of land and additions on the property. | Land | Improvement |
|---|---|---|---|---|
| 2024 | $1,074 | $27,810 | $3,040 | $24,770 |
| 2023 | $1,074 | $27,810 | $3,040 | $24,770 |
| 2022 | $1,028 | $24,190 | $2,650 | $21,540 |
| 2021 | $1,028 | $24,190 | $2,650 | $21,540 |
| 2020 | $1,002 | $24,190 | $2,650 | $21,540 |
| 2019 | $886 | $19,930 | $3,430 | $16,500 |
| 2018 | $886 | $19,930 | $3,430 | $16,500 |
| 2017 | $491 | $19,930 | $3,430 | $16,500 |
| 2016 | $427 | $18,440 | $3,170 | $15,270 |
| 2015 | $429 | $18,440 | $3,170 | $15,270 |
| 2014 | $431 | $18,440 | $3,170 | $15,270 |
| 2013 | $522 | $19,830 | $2,990 | $16,840 |
Source: Public Records
Map
Nearby Homes