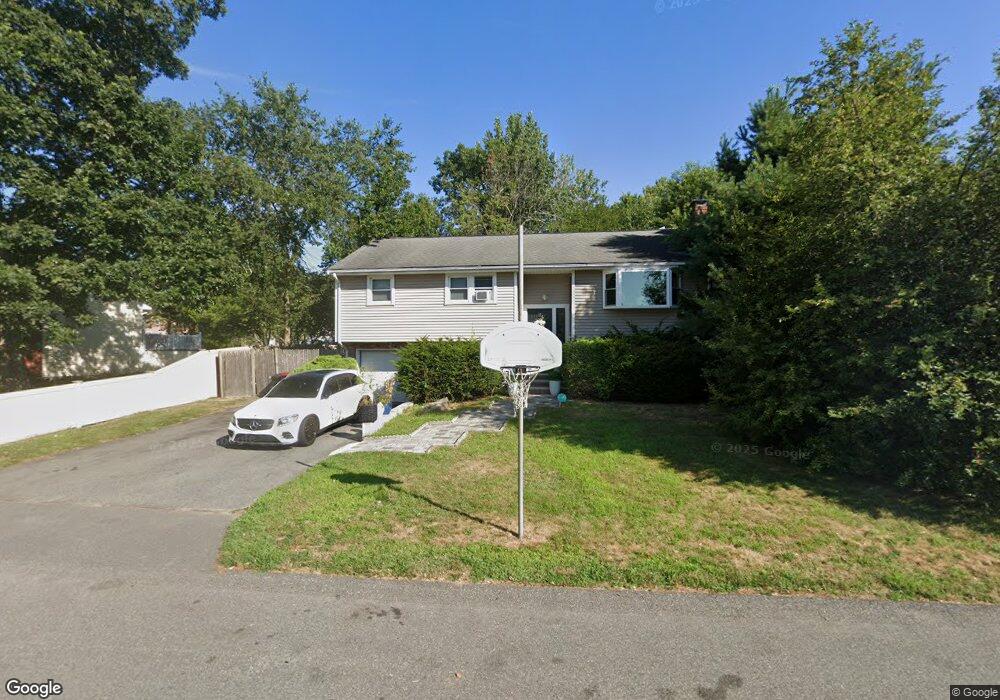
8 Nauset Rd Brockton, MA 02301
Brockton Heights NeighborhoodEstimated Value: $547,000 - $583,000
3
Beds
2
Baths
1,122
Sq Ft
$499/Sq Ft
Est. Value
About This Home
This home is located at 8 Nauset Rd, Brockton, MA 02301 and is currently estimated at $560,175, approximately $499 per square foot. 8 Nauset Rd is a home located in Plymouth County with nearby schools including Hancock Elementary School, Manthala George Jr. School, and Louis F Angelo Elementary School.
Ownership History
Date
Name
Owned For
Owner Type
Purchase Details
Closed on
Mar 28, 2016
Sold by
Dafonseca Ilka P
Bought by
8 Nauset Road Rt
Current Estimated Value
Purchase Details
Closed on
Aug 1, 2007
Sold by
Connor Michael P and Connor Maria B
Bought by
Dafonseca Ilka P
Home Financials for this Owner
Home Financials are based on the most recent Mortgage that was taken out on this home.
Original Mortgage
$295,000
Interest Rate
6.73%
Mortgage Type
Purchase Money Mortgage
Purchase Details
Closed on
Apr 30, 2001
Sold by
Schmidt James J and Schmidt Idalia
Bought by
Connor Michael P and Connor Maria B
Purchase Details
Closed on
Jun 25, 1997
Sold by
Reynolds Ying M
Bought by
Schmidt James J and Schmidt Idalia
Create a Home Valuation Report for This Property
The Home Valuation Report is an in-depth analysis detailing your home's value as well as a comparison with similar homes in the area
Home Values in the Area
Average Home Value in this Area
Purchase History
| Date | Buyer | Sale Price | Title Company |
|---|---|---|---|
| 8 Nauset Road Rt | $191,000 | -- | |
| Dafonseca Ilka P | $295,000 | -- | |
| Connor Michael P | $209,000 | -- | |
| Schmidt James J | $115,000 | -- |
Source: Public Records
Mortgage History
| Date | Status | Borrower | Loan Amount |
|---|---|---|---|
| Previous Owner | Schmidt James J | $295,000 | |
| Previous Owner | Schmidt James J | $80,000 | |
| Previous Owner | Schmidt James J | $189,000 |
Source: Public Records
Tax History Compared to Growth
Tax History
| Year | Tax Paid | Tax Assessment Tax Assessment Total Assessment is a certain percentage of the fair market value that is determined by local assessors to be the total taxable value of land and additions on the property. | Land | Improvement |
|---|---|---|---|---|
| 2025 | $5,933 | $489,900 | $145,100 | $344,800 |
| 2024 | $5,847 | $486,400 | $145,100 | $341,300 |
| 2023 | $5,975 | $460,300 | $110,100 | $350,200 |
| 2022 | $5,377 | $384,900 | $100,100 | $284,800 |
| 2021 | $5,003 | $345,000 | $95,000 | $250,000 |
| 2020 | $5,031 | $332,100 | $91,000 | $241,100 |
| 2019 | $4,765 | $306,600 | $85,500 | $221,100 |
| 2018 | $4,376 | $272,500 | $85,500 | $187,000 |
| 2017 | $4,405 | $273,600 | $85,500 | $188,100 |
| 2016 | $3,771 | $217,200 | $81,500 | $135,700 |
| 2015 | $3,893 | $214,500 | $81,500 | $133,000 |
| 2014 | $3,735 | $206,000 | $81,500 | $124,500 |
Source: Public Records
Map
Nearby Homes