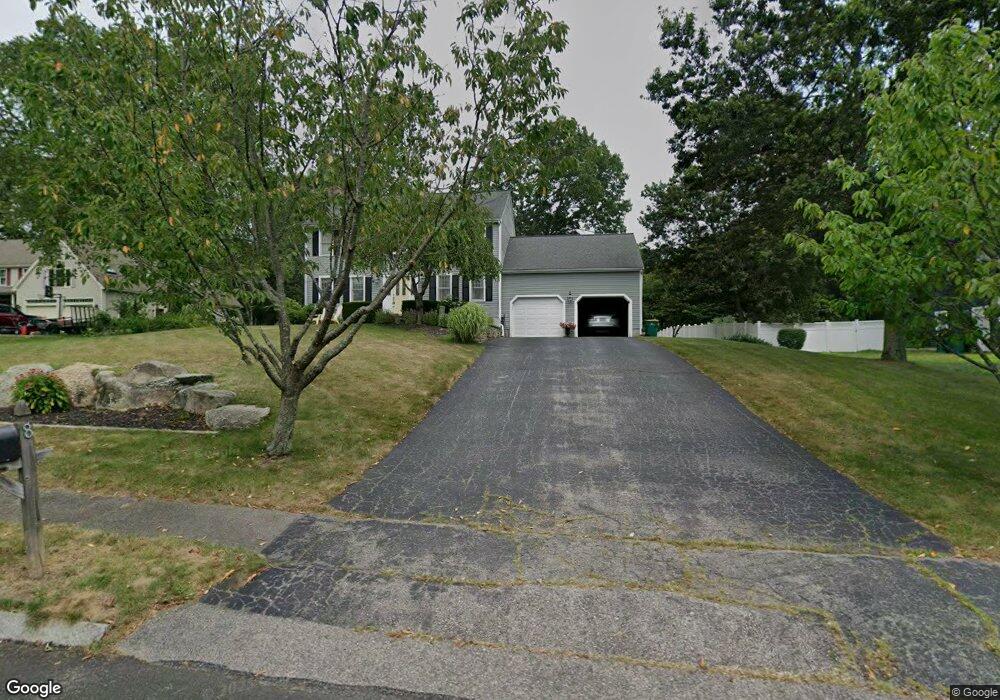
8 Nelson Way Mansfield, MA 02048
Estimated Value: $746,000 - $856,000
3
Beds
3
Baths
1,872
Sq Ft
$426/Sq Ft
Est. Value
About This Home
This home is located at 8 Nelson Way, Mansfield, MA 02048 and is currently estimated at $798,348, approximately $426 per square foot. 8 Nelson Way is a home located in Bristol County with nearby schools including Everett W. Robinson Elementary School, Jordan/Jackson Elementary School, and Harold L. Qualters Middle School.
Ownership History
Date
Name
Owned For
Owner Type
Purchase Details
Closed on
Nov 8, 2019
Sold by
Roberts Elias P and Roberts Francis H
Bought by
Roberts Elisa P
Current Estimated Value
Home Financials for this Owner
Home Financials are based on the most recent Mortgage that was taken out on this home.
Original Mortgage
$427,118
Outstanding Balance
$373,350
Interest Rate
3.5%
Mortgage Type
New Conventional
Estimated Equity
$424,998
Purchase Details
Closed on
Jun 12, 1998
Sold by
Murray John H and Murray Diana V
Bought by
Spellman Francis R and Spellman Kathleen M
Home Financials for this Owner
Home Financials are based on the most recent Mortgage that was taken out on this home.
Original Mortgage
$198,400
Interest Rate
7.11%
Mortgage Type
Purchase Money Mortgage
Purchase Details
Closed on
Jan 4, 1991
Sold by
Nautical Rt
Bought by
Murray John and Murray Diane
Create a Home Valuation Report for This Property
The Home Valuation Report is an in-depth analysis detailing your home's value as well as a comparison with similar homes in the area
Home Values in the Area
Average Home Value in this Area
Purchase History
| Date | Buyer | Sale Price | Title Company |
|---|---|---|---|
| Roberts Elisa P | -- | -- | |
| Spellman Francis R | $248,000 | -- | |
| Murray John | $191,900 | -- | |
| Murray John | $191,900 | -- |
Source: Public Records
Mortgage History
| Date | Status | Borrower | Loan Amount |
|---|---|---|---|
| Open | Roberts Elisa P | $427,118 | |
| Previous Owner | Murray John | $68,900 | |
| Previous Owner | Murray John | $12,000 | |
| Previous Owner | Murray John | $198,400 |
Source: Public Records
Tax History Compared to Growth
Tax History
| Year | Tax Paid | Tax Assessment Tax Assessment Total Assessment is a certain percentage of the fair market value that is determined by local assessors to be the total taxable value of land and additions on the property. | Land | Improvement |
|---|---|---|---|---|
| 2025 | $9,320 | $707,700 | $278,100 | $429,600 |
| 2024 | $9,144 | $677,300 | $290,200 | $387,100 |
| 2023 | $8,854 | $628,400 | $290,200 | $338,200 |
| 2022 | $8,306 | $547,500 | $268,600 | $278,900 |
| 2021 | $8,019 | $522,100 | $223,900 | $298,200 |
| 2020 | $7,898 | $514,200 | $223,900 | $290,300 |
| 2019 | $7,298 | $479,500 | $186,500 | $293,000 |
| 2018 | $6,979 | $465,500 | $177,800 | $287,700 |
| 2017 | $6,798 | $452,600 | $172,800 | $279,800 |
| 2016 | $6,435 | $417,600 | $164,500 | $253,100 |
| 2015 | $6,273 | $404,700 | $164,500 | $240,200 |
Source: Public Records
Map
Nearby Homes
- 4 Buckskin Dr
- 24 Maverick Dr
- 150 Gilbert St
- 176 Elm St
- 255 Mckeon Dr
- 450 West St
- 2 Oak St Unit 2D
- 2 Oak St Unit 2A
- 2 Oak St Unit 2C
- 2 Oak St Unit 2B
- 406 South St
- 231 Spring St
- 196 Donald Tennant Cir
- 451R Gilbert St
- 11 Landry Ave
- 116 George St
- 37 Oakleaf Dr
- 16 Treasure Island Rd
- 115 Westfield Dr
- 277 Central St