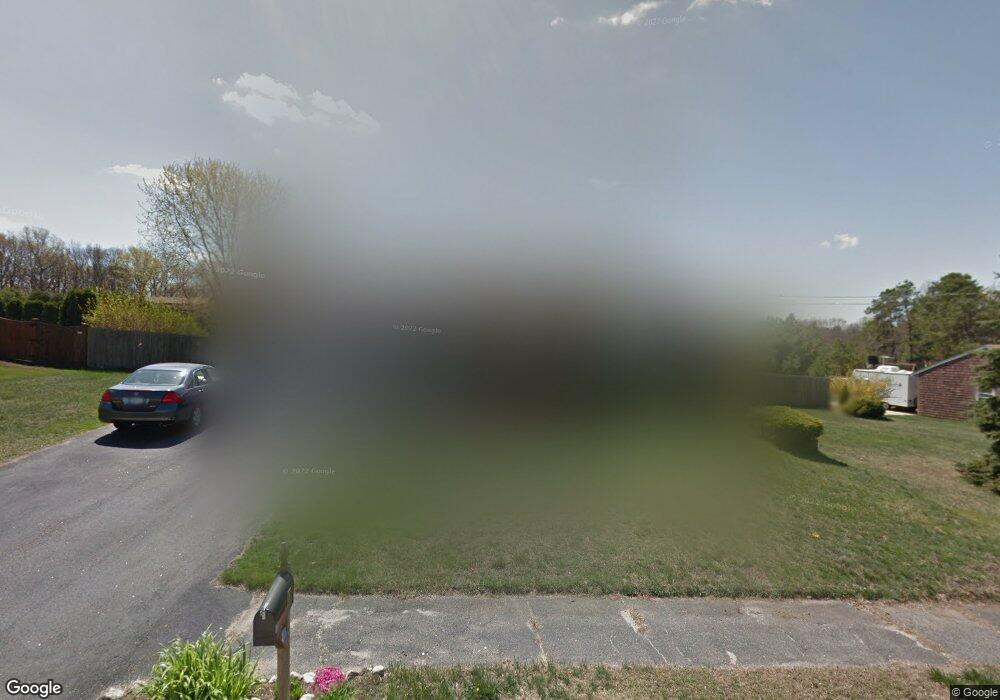
8 Nichole Ln Coventry, RI 02816
Estimated Value: $442,703 - $493,000
3
Beds
1
Bath
1,638
Sq Ft
$284/Sq Ft
Est. Value
About This Home
This home is located at 8 Nichole Ln, Coventry, RI 02816 and is currently estimated at $464,676, approximately $283 per square foot. 8 Nichole Ln is a home located in Kent County with nearby schools including Alan Shawn Feinstein Ms Of Cov, Coventry High School, and Father John V. Doyle School.
Ownership History
Date
Name
Owned For
Owner Type
Purchase Details
Closed on
Oct 16, 2002
Sold by
Fanning John M and Myer Norma C
Bought by
Pierson James P and Pierson Kristen A
Current Estimated Value
Home Financials for this Owner
Home Financials are based on the most recent Mortgage that was taken out on this home.
Original Mortgage
$180,500
Interest Rate
6.18%
Purchase Details
Closed on
Aug 1, 1989
Sold by
Padula Stephen
Bought by
Fanning John
Create a Home Valuation Report for This Property
The Home Valuation Report is an in-depth analysis detailing your home's value as well as a comparison with similar homes in the area
Home Values in the Area
Average Home Value in this Area
Purchase History
| Date | Buyer | Sale Price | Title Company |
|---|---|---|---|
| Pierson James P | $190,000 | -- | |
| Fanning John | $120,000 | -- |
Source: Public Records
Mortgage History
| Date | Status | Borrower | Loan Amount |
|---|---|---|---|
| Open | Pierson James P | $225,000 | |
| Closed | Pierson James P | $130,000 | |
| Closed | Fanning John | $70,000 | |
| Closed | Fanning John | $182,000 | |
| Closed | Fanning John | $52,000 | |
| Closed | Fanning John | $180,500 |
Source: Public Records
Tax History Compared to Growth
Tax History
| Year | Tax Paid | Tax Assessment Tax Assessment Total Assessment is a certain percentage of the fair market value that is determined by local assessors to be the total taxable value of land and additions on the property. | Land | Improvement |
|---|---|---|---|---|
| 2024 | $5,316 | $335,600 | $128,900 | $206,700 |
| 2023 | $5,145 | $335,600 | $128,900 | $206,700 |
| 2022 | $4,986 | $254,800 | $122,000 | $132,800 |
| 2021 | $4,943 | $254,800 | $122,000 | $132,800 |
| 2020 | $5,667 | $254,800 | $122,000 | $132,800 |
| 2019 | $4,779 | $214,900 | $98,600 | $116,300 |
| 2018 | $4,644 | $214,900 | $98,600 | $116,300 |
| 2017 | $4,509 | $214,900 | $98,600 | $116,300 |
| 2016 | $4,365 | $203,900 | $108,000 | $95,900 |
| 2015 | $4,247 | $203,900 | $108,000 | $95,900 |
| 2014 | $4,159 | $203,900 | $108,000 | $95,900 |
| 2013 | $3,872 | $207,500 | $101,100 | $106,400 |
Source: Public Records
Map
Nearby Homes