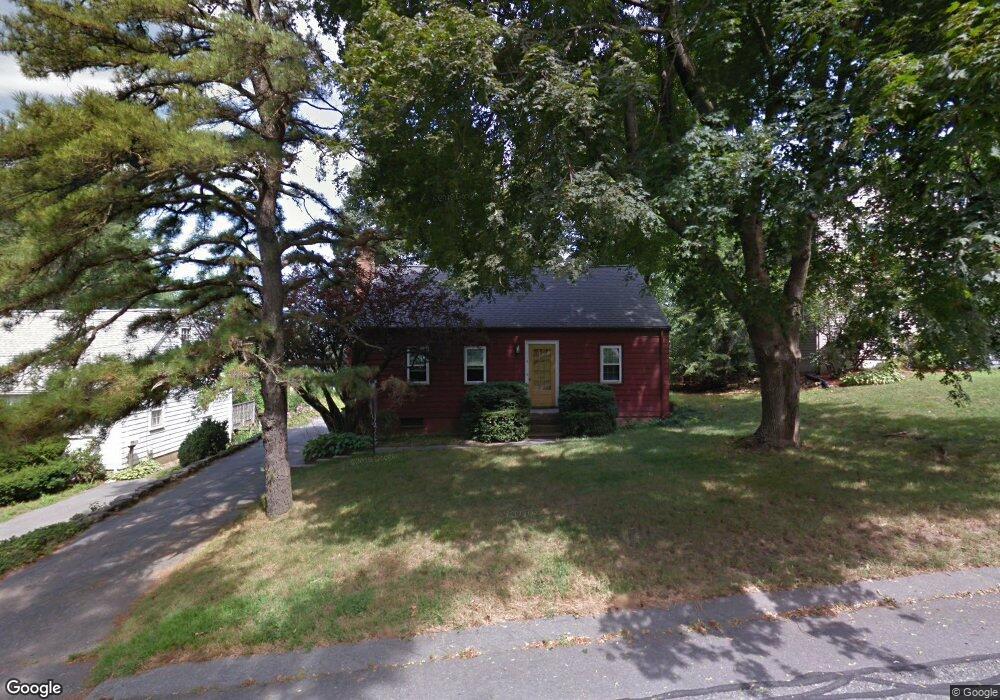
8 Nichols Rd Lexington, MA 02420
North Lexington NeighborhoodEstimated Value: $1,151,000 - $1,244,000
3
Beds
2
Baths
1,593
Sq Ft
$744/Sq Ft
Est. Value
About This Home
This home is located at 8 Nichols Rd, Lexington, MA 02420 and is currently estimated at $1,185,336, approximately $744 per square foot. 8 Nichols Rd is a home located in Middlesex County with nearby schools including Joseph Estabrook Elementary School, William Diamond Middle School, and Lexington High School.
Ownership History
Date
Name
Owned For
Owner Type
Purchase Details
Closed on
Mar 11, 2022
Sold by
Levine Eliott C
Bought by
Ross Michael B and Ross Stacey B
Current Estimated Value
Home Financials for this Owner
Home Financials are based on the most recent Mortgage that was taken out on this home.
Original Mortgage
$880,000
Outstanding Balance
$819,249
Interest Rate
3.92%
Mortgage Type
Purchase Money Mortgage
Estimated Equity
$366,087
Purchase Details
Closed on
Nov 18, 2021
Sold by
R E Mellican T 2013 and Mellican
Bought by
Levine Eliott C
Purchase Details
Closed on
Sep 1, 1976
Bought by
Mellican R Eugene and Mellican Alice N
Create a Home Valuation Report for This Property
The Home Valuation Report is an in-depth analysis detailing your home's value as well as a comparison with similar homes in the area
Home Values in the Area
Average Home Value in this Area
Purchase History
| Date | Buyer | Sale Price | Title Company |
|---|---|---|---|
| Ross Michael B | $1,100,000 | None Available | |
| Levine Eliott C | $650,000 | None Available | |
| Mellican R Eugene | $56,500 | -- |
Source: Public Records
Mortgage History
| Date | Status | Borrower | Loan Amount |
|---|---|---|---|
| Open | Ross Michael B | $880,000 |
Source: Public Records
Tax History Compared to Growth
Tax History
| Year | Tax Paid | Tax Assessment Tax Assessment Total Assessment is a certain percentage of the fair market value that is determined by local assessors to be the total taxable value of land and additions on the property. | Land | Improvement |
|---|---|---|---|---|
| 2025 | $13,159 | $1,076,000 | $773,000 | $303,000 |
| 2024 | $12,716 | $1,038,000 | $737,000 | $301,000 |
| 2023 | $12,181 | $937,000 | $670,000 | $267,000 |
| 2022 | $11,702 | $848,000 | $609,000 | $239,000 |
| 2021 | $11,311 | $786,000 | $555,000 | $231,000 |
| 2020 | $11,043 | $786,000 | $555,000 | $231,000 |
| 2019 | $10,618 | $752,000 | $529,000 | $223,000 |
| 2018 | $10,067 | $704,000 | $503,000 | $201,000 |
| 2017 | $10,244 | $707,000 | $492,000 | $215,000 |
| 2016 | $9,329 | $639,000 | $448,000 | $191,000 |
| 2015 | $8,901 | $599,000 | $408,000 | $191,000 |
| 2014 | $7,864 | $507,000 | $371,000 | $136,000 |
Source: Public Records
Map
Nearby Homes
- 3a Nowers Rd
- 101 Burlington St
- 103 N Hancock St
- 25 Flintlock Rd
- 231 Bedford St
- 17 Hamilton Rd
- 18 Robinson Rd
- 125 Burlington St
- 24 Vaille Ave
- 12 Coolidge Ave
- 93 Bedford St Unit 201
- 93 Bedford St Unit 308
- 93 Bedford St Unit 101
- 36 Adams St
- 45 Hancock St
- 3 Brown Rd
- 32 Edgewood Rd Unit 1
- 30 Meriam St Unit 30
- 83 Winter St
- 18 Heritage Dr