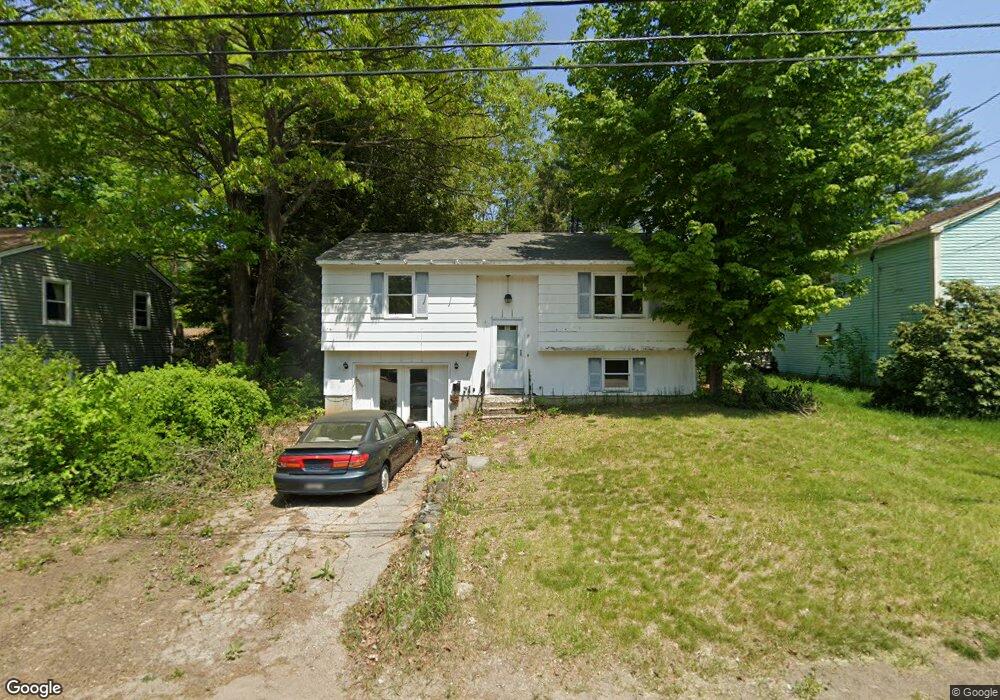
8 Nutter St Rochester, NH 03867
Estimated Value: $311,784 - $356,000
3
Beds
1
Bath
858
Sq Ft
$394/Sq Ft
Est. Value
About This Home
This home is located at 8 Nutter St, Rochester, NH 03867 and is currently estimated at $338,196, approximately $394 per square foot. 8 Nutter St is a home located in Strafford County with nearby schools including Chamberlain Street School, Rochester Middle School, and Spaulding High School.
Ownership History
Date
Name
Owned For
Owner Type
Purchase Details
Closed on
Apr 22, 2016
Sold by
Sclough Arlene S
Bought by
Arlene S Sclough Ret
Current Estimated Value
Purchase Details
Closed on
Jun 4, 2002
Sold by
Ruby Michael D and Ruby Kimberly S
Bought by
Laroche David E
Home Financials for this Owner
Home Financials are based on the most recent Mortgage that was taken out on this home.
Original Mortgage
$98,000
Interest Rate
7%
Purchase Details
Closed on
Jun 2, 1997
Sold by
Knowlton Jeffrey R and Knowlton Jane M
Bought by
Ruby Michael D and Ruby Kimberly S
Home Financials for this Owner
Home Financials are based on the most recent Mortgage that was taken out on this home.
Original Mortgage
$81,391
Interest Rate
8.09%
Create a Home Valuation Report for This Property
The Home Valuation Report is an in-depth analysis detailing your home's value as well as a comparison with similar homes in the area
Home Values in the Area
Average Home Value in this Area
Purchase History
| Date | Buyer | Sale Price | Title Company |
|---|---|---|---|
| Arlene S Sclough Ret | -- | -- | |
| Laroche David E | $109,900 | -- | |
| Ruby Michael D | $81,900 | -- |
Source: Public Records
Mortgage History
| Date | Status | Borrower | Loan Amount |
|---|---|---|---|
| Previous Owner | Ruby Michael D | $98,000 | |
| Previous Owner | Ruby Michael D | $81,391 |
Source: Public Records
Tax History
| Year | Tax Paid | Tax Assessment Tax Assessment Total Assessment is a certain percentage of the fair market value that is determined by local assessors to be the total taxable value of land and additions on the property. | Land | Improvement |
|---|---|---|---|---|
| 2025 | $4,019 | $262,700 | $67,900 | $194,800 |
| 2024 | $4,096 | $275,800 | $67,900 | $207,900 |
| 2023 | $4,471 | $173,700 | $52,700 | $121,000 |
| 2022 | $4,391 | $173,700 | $52,700 | $121,000 |
| 2021 | $4,282 | $173,700 | $52,700 | $121,000 |
| 2020 | $4,277 | $173,800 | $52,700 | $121,100 |
| 2019 | $4,328 | $173,800 | $52,700 | $121,100 |
| 2018 | $4,681 | $170,100 | $39,500 | $130,600 |
| 2017 | $4,479 | $170,100 | $39,500 | $130,600 |
| 2016 | $3,937 | $139,300 | $39,500 | $99,800 |
| 2015 | $3,921 | $139,300 | $39,500 | $99,800 |
| 2014 | $3,827 | $139,300 | $39,500 | $99,800 |
| 2013 | $3,717 | $141,000 | $52,700 | $88,300 |
| 2012 | $3,621 | $141,000 | $52,700 | $88,300 |
Source: Public Records
Map
Nearby Homes
- 8 Adams Ave
- 0 Franklin St Unit 55 4959653
- 20 Franklin Heights
- 10 Sarah Ct
- 16 Springfield Estates
- 7 Collins Cir
- 68 Moose Ln
- 45 Hanson St
- 33 Linden St
- 24 Jeremiah Ln
- 43 Fieldstone Ln
- 2 Barker Ct
- 46 Limestone Ln
- 18 Wakefield St
- 2 Freedom Dr
- 35 Brownstone Ln
- 3 Freedom Dr Unit 17
- 15 Linden St
- 9 Freedom Dr Unit Lot 16
- 3 Dodge St
Your Personal Tour Guide
Ask me questions while you tour the home.