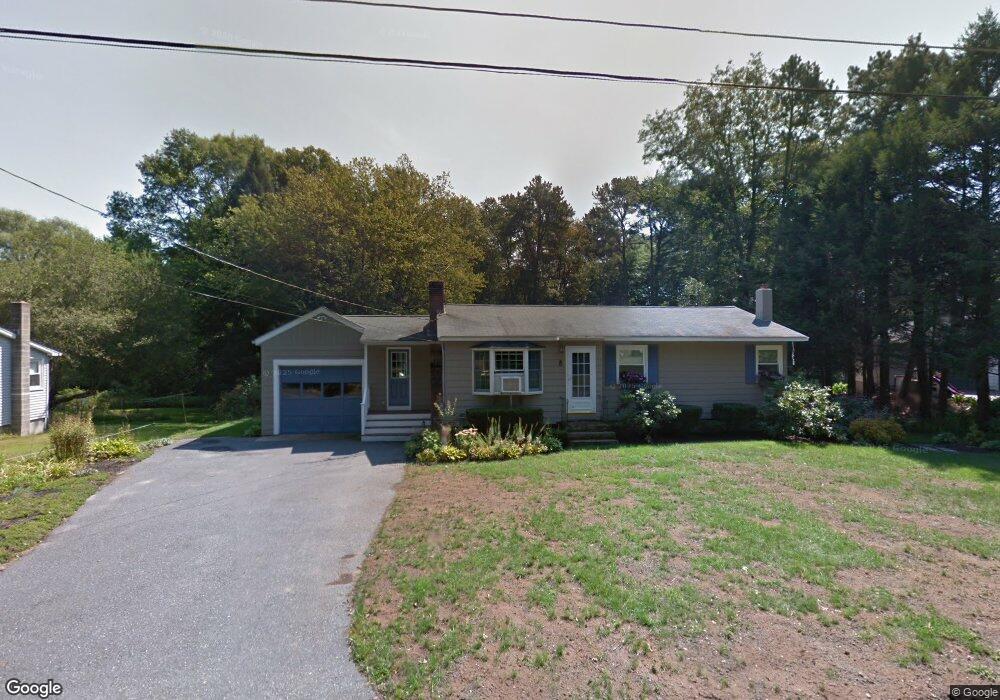
8 Oakview Cir Medway, MA 02053
Estimated Value: $485,000 - $624,217
3
Beds
2
Baths
994
Sq Ft
$559/Sq Ft
Est. Value
About This Home
This home is located at 8 Oakview Cir, Medway, MA 02053 and is currently estimated at $555,304, approximately $558 per square foot. 8 Oakview Cir is a home located in Norfolk County with nearby schools including John D. McGovern Elementary School, Burke-Memorial Elementary, and Medway Middle School.
Ownership History
Date
Name
Owned For
Owner Type
Purchase Details
Closed on
Jul 15, 1998
Sold by
Wolfe John D and Wolfe Lucia M
Bought by
Lewis Brian D and Lewis Diane M
Current Estimated Value
Home Financials for this Owner
Home Financials are based on the most recent Mortgage that was taken out on this home.
Original Mortgage
$108,200
Interest Rate
6.98%
Mortgage Type
Purchase Money Mortgage
Purchase Details
Closed on
Mar 1, 1990
Sold by
Tucker Robert K
Bought by
Wolfe John D
Create a Home Valuation Report for This Property
The Home Valuation Report is an in-depth analysis detailing your home's value as well as a comparison with similar homes in the area
Home Values in the Area
Average Home Value in this Area
Purchase History
| Date | Buyer | Sale Price | Title Company |
|---|---|---|---|
| Lewis Brian D | $170,000 | -- | |
| Wolfe John D | $143,000 | -- |
Source: Public Records
Mortgage History
| Date | Status | Borrower | Loan Amount |
|---|---|---|---|
| Open | Wolfe John D | $207,000 | |
| Closed | Wolfe John D | $178,000 | |
| Closed | Wolfe John D | $108,200 |
Source: Public Records
Tax History Compared to Growth
Tax History
| Year | Tax Paid | Tax Assessment Tax Assessment Total Assessment is a certain percentage of the fair market value that is determined by local assessors to be the total taxable value of land and additions on the property. | Land | Improvement |
|---|---|---|---|---|
| 2025 | $6,737 | $472,800 | $293,000 | $179,800 |
| 2024 | $6,808 | $472,800 | $293,000 | $179,800 |
| 2023 | $6,325 | $396,800 | $242,800 | $154,000 |
| 2022 | $6,237 | $368,400 | $215,600 | $152,800 |
| 2021 | $5,940 | $340,200 | $198,800 | $141,400 |
| 2020 | $5,698 | $325,600 | $184,200 | $141,400 |
| 2019 | $5,520 | $325,300 | $184,200 | $141,100 |
| 2018 | $5,302 | $300,200 | $159,100 | $141,100 |
| 2017 | $5,274 | $294,300 | $159,100 | $135,200 |
| 2016 | $4,835 | $267,000 | $140,700 | $126,300 |
| 2015 | $4,595 | $251,900 | $125,600 | $126,300 |
| 2014 | $4,610 | $244,700 | $134,000 | $110,700 |
Source: Public Records
Map
Nearby Homes