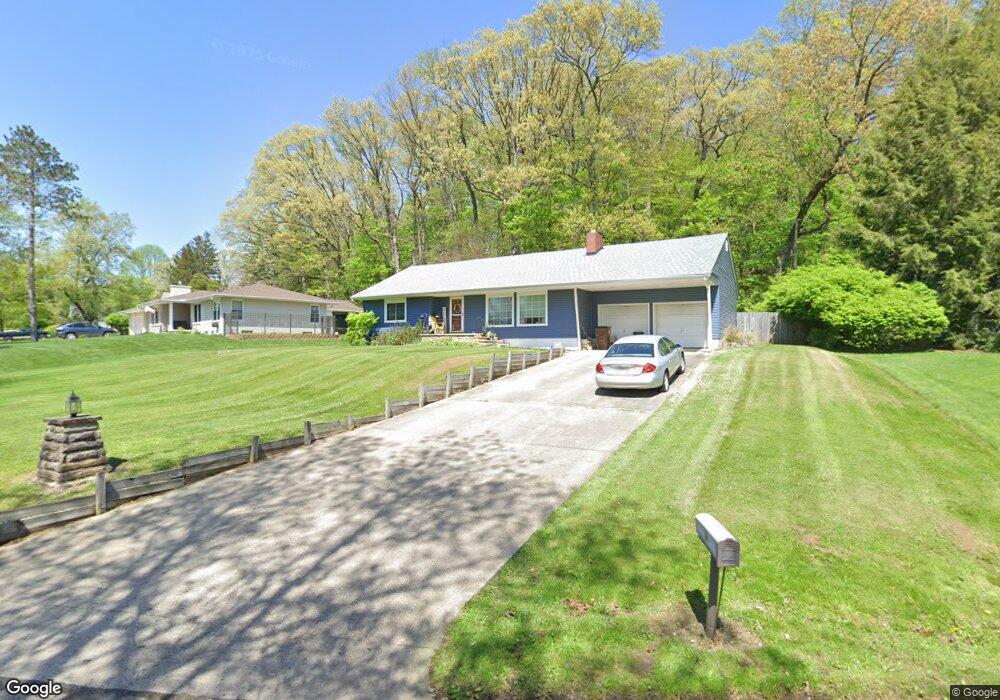
8 Orchard Dr Mount Vernon, OH 43050
Estimated Value: $267,627 - $337,000
3
Beds
3
Baths
1,600
Sq Ft
$190/Sq Ft
Est. Value
About This Home
This home is located at 8 Orchard Dr, Mount Vernon, OH 43050 and is currently estimated at $304,657, approximately $190 per square foot. 8 Orchard Dr is a home located in Knox County with nearby schools including Mount Vernon High School, St. Vincent de Paul School, and Christian Star Academy.
Ownership History
Date
Name
Owned For
Owner Type
Purchase Details
Closed on
Jul 10, 2013
Sold by
Simmons Jo Lee and Carrier Jo Lee
Bought by
Carrier William Dale
Current Estimated Value
Home Financials for this Owner
Home Financials are based on the most recent Mortgage that was taken out on this home.
Original Mortgage
$131,773
Outstanding Balance
$95,453
Interest Rate
3.83%
Mortgage Type
Assumption
Estimated Equity
$209,204
Purchase Details
Closed on
Jul 16, 2001
Sold by
Whitaker Paul H and Whitaker Ellen
Bought by
Simmons Jo Lee
Create a Home Valuation Report for This Property
The Home Valuation Report is an in-depth analysis detailing your home's value as well as a comparison with similar homes in the area
Home Values in the Area
Average Home Value in this Area
Purchase History
| Date | Buyer | Sale Price | Title Company |
|---|---|---|---|
| Carrier William Dale | $96,750 | None Available | |
| Simmons Jo Lee | $126,000 | -- |
Source: Public Records
Mortgage History
| Date | Status | Borrower | Loan Amount |
|---|---|---|---|
| Open | Carrier William Dale | $131,773 |
Source: Public Records
Tax History
| Year | Tax Paid | Tax Assessment Tax Assessment Total Assessment is a certain percentage of the fair market value that is determined by local assessors to be the total taxable value of land and additions on the property. | Land | Improvement |
|---|---|---|---|---|
| 2024 | $2,536 | $67,240 | $16,400 | $50,840 |
| 2023 | $2,593 | $67,240 | $16,400 | $50,840 |
| 2022 | $1,966 | $46,370 | $11,310 | $35,060 |
| 2021 | $1,966 | $46,370 | $11,310 | $35,060 |
| 2020 | $1,915 | $46,370 | $11,310 | $35,060 |
| 2019 | $2,028 | $45,780 | $11,870 | $33,910 |
| 2018 | $2,028 | $45,780 | $11,870 | $33,910 |
| 2017 | $1,991 | $45,780 | $11,870 | $33,910 |
| 2016 | $1,847 | $42,390 | $10,990 | $31,400 |
| 2015 | $1,855 | $42,390 | $10,990 | $31,400 |
| 2014 | $1,865 | $42,390 | $10,990 | $31,400 |
| 2013 | $1,972 | $42,710 | $10,330 | $32,380 |
Source: Public Records
Map
Nearby Homes
- 4 Craig Dr
- 6 Edgewood Blvd
- 900 E Gambier St
- 501 Oak St
- 604 E Gambier St
- 655 Howard St
- 108 Ringold St
- 600 1/2 E Chestnut St
- 600 E Chestnut St Unit 1/2
- 1 Hilltop Dr
- 200 Eastwood Dr
- 220 Coshocton Ave
- 175 Briar Wood Dr
- 213 Coshocton Ave
- 13 Eastgate Dr
- 418 E Pleasant St
- 1575 New Gambier Rd
- 0 Miami St
- 419 E Pleasant St
- 104 N Park St
Your Personal Tour Guide
Ask me questions while you tour the home.