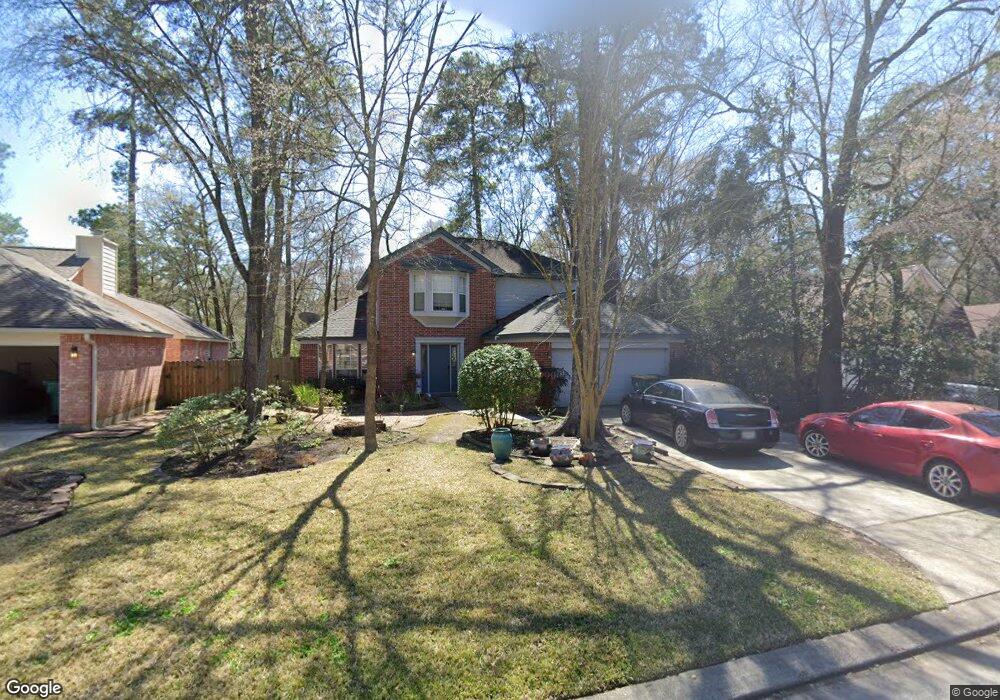
8 Painted Sunset Spring, TX 77380
Grogan's Mill NeighborhoodEstimated Value: $347,593 - $393,000
3
Beds
3
Baths
1,987
Sq Ft
$187/Sq Ft
Est. Value
About This Home
This home is located at 8 Painted Sunset, Spring, TX 77380 and is currently estimated at $370,648, approximately $186 per square foot. 8 Painted Sunset is a home located in Montgomery County with nearby schools including Hailey Elementary School, W.D Wilkerson Intermediate School, and Knox J High School.
Ownership History
Date
Name
Owned For
Owner Type
Purchase Details
Closed on
Jul 24, 2003
Sold by
Starzyk Michael A and Starzyk Laura L
Bought by
Loftiss Matthew and Loftiss Heather
Current Estimated Value
Home Financials for this Owner
Home Financials are based on the most recent Mortgage that was taken out on this home.
Original Mortgage
$143,500
Outstanding Balance
$60,503
Interest Rate
5.15%
Mortgage Type
Purchase Money Mortgage
Estimated Equity
$310,145
Purchase Details
Closed on
Aug 22, 1994
Sold by
The Ryland Group Inc
Bought by
Starzyk Michael A and Starzyk Laura L
Home Financials for this Owner
Home Financials are based on the most recent Mortgage that was taken out on this home.
Original Mortgage
$102,050
Interest Rate
8.69%
Purchase Details
Closed on
Jun 8, 1994
Sold by
Woodlands Land Dev Lp
Bought by
Loftiss Matthew and Loftiss Heather
Create a Home Valuation Report for This Property
The Home Valuation Report is an in-depth analysis detailing your home's value as well as a comparison with similar homes in the area
Home Values in the Area
Average Home Value in this Area
Purchase History
| Date | Buyer | Sale Price | Title Company |
|---|---|---|---|
| Loftiss Matthew | -- | Stewart Title | |
| Starzyk Michael A | -- | Cornerstone Title | |
| Loftiss Matthew | -- | -- |
Source: Public Records
Mortgage History
| Date | Status | Borrower | Loan Amount |
|---|---|---|---|
| Open | Loftiss Matthew | $143,500 | |
| Previous Owner | Starzyk Michael A | $102,050 |
Source: Public Records
Tax History
| Year | Tax Paid | Tax Assessment Tax Assessment Total Assessment is a certain percentage of the fair market value that is determined by local assessors to be the total taxable value of land and additions on the property. | Land | Improvement |
|---|---|---|---|---|
| 2025 | $3,923 | $314,733 | -- | -- |
| 2024 | $3,493 | $286,121 | -- | -- |
| 2023 | $3,493 | $260,110 | $50,000 | $260,860 |
| 2022 | $4,778 | $236,460 | $50,000 | $235,270 |
| 2021 | $4,690 | $214,960 | $14,980 | $199,980 |
| 2020 | $4,834 | $212,210 | $14,980 | $197,230 |
| 2019 | $4,917 | $208,840 | $14,980 | $195,230 |
| 2018 | $3,863 | $189,850 | $14,980 | $174,870 |
| 2017 | $4,525 | $189,850 | $14,980 | $174,870 |
| 2016 | $4,525 | $189,850 | $14,980 | $174,870 |
| 2015 | $3,685 | $176,670 | $14,980 | $174,870 |
| 2014 | $3,685 | $160,610 | $14,980 | $161,920 |
Source: Public Records
Map
Nearby Homes
- 9 S Brook Pebble Ct
- 19 Evening Song Ct
- 30 N Drifting Leaf Ct
- 37 Rockfern Ct
- 56 N Morningwood Ct
- 138 N Dreamweaver Cir
- 43 Country Forest Ct
- 49 Country Forest Ct
- 22 Camberwell Ct
- 19 Tulip Hill Ct
- 10 S Greenbud Ct
- 22 S Rain Forest Ct
- 3 Rain Walk Ct
- 34 Green Bough Ct
- 4 Sawmill Grove Ln
- 713 Sawdust Rd
- 2005 Carlson Creek Dr
- 723 Shadowbrook Dr
- 118 Angel Leaf Rd
- 2107 Level Oak Place
- 12 Painted Sunset
- 4 Painted Sunset
- 9 N White Pebble Ct
- 16 Painted Sunset
- 7 N White Pebble Ct
- 12 N White Pebble Ct
- 11 Painted Sunset
- 7 Painted Sunset
- 20 Painted Sunset
- 15 Painted Sunset
- 5 N White Pebble Ct
- 3 Painted Sunset
- 8 N White Pebble Ct
- 1 Painted Sunset
- 22 S Dreamweaver Cir
- 6 N White Pebble Ct
- 3 N White Pebble Ct
- 9 N Brook Pebble Ct
- 26 S Dreamweaver Cir
- 7 N Brook Pebble Ct
Your Personal Tour Guide
Ask me questions while you tour the home.