Estimated Value: $291,495 - $488,000
--
Bed
--
Bath
1,592
Sq Ft
$271/Sq Ft
Est. Value
About This Home
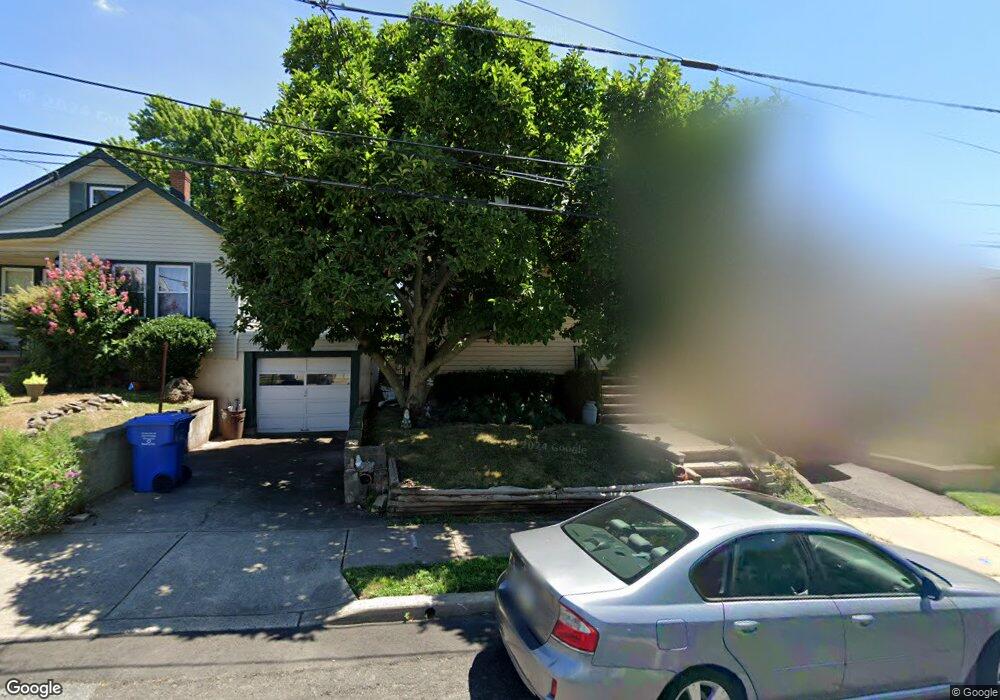
This home is located at 8 Paul St, Fords, NJ 08863 and is currently estimated at $431,624, approximately $271 per square foot. 8 Paul St is a home located in Middlesex County with nearby schools including Menlo Park Terrace School, Fords Middle School, and Woodbridge High School.
Ownership History
Date
Name
Owned For
Owner Type
Purchase Details
Closed on
May 27, 2009
Sold by
Fazzi George B
Bought by
Fazzi Dolores
Current Estimated Value
Home Financials for this Owner
Home Financials are based on the most recent Mortgage that was taken out on this home.
Original Mortgage
$192,000
Outstanding Balance
$121,635
Interest Rate
4.82%
Mortgage Type
Purchase Money Mortgage
Estimated Equity
$309,989
Purchase Details
Closed on
Feb 25, 2004
Sold by
Bubenheimer Marjory
Bought by
Fazzi Dolores
Home Financials for this Owner
Home Financials are based on the most recent Mortgage that was taken out on this home.
Original Mortgage
$133,500
Interest Rate
5.6%
Create a Home Valuation Report for This Property
The Home Valuation Report is an in-depth analysis detailing your home's value as well as a comparison with similar homes in the area
Home Values in the Area
Average Home Value in this Area
Purchase History
| Date | Buyer | Sale Price | Title Company |
|---|---|---|---|
| Fazzi Dolores | $20,000 | None Available | |
| Fazzi Dolores | $190,000 | -- |
Source: Public Records
Mortgage History
| Date | Status | Borrower | Loan Amount |
|---|---|---|---|
| Open | Fazzi Dolores | $192,000 | |
| Previous Owner | Fazzi Dolores | $133,500 |
Source: Public Records
Tax History Compared to Growth
Tax History
| Year | Tax Paid | Tax Assessment Tax Assessment Total Assessment is a certain percentage of the fair market value that is determined by local assessors to be the total taxable value of land and additions on the property. | Land | Improvement |
|---|---|---|---|---|
| 2025 | $6,831 | $54,100 | $16,600 | $37,500 |
| 2024 | $6,632 | $54,100 | $16,600 | $37,500 |
| 2023 | $6,632 | $54,100 | $16,600 | $37,500 |
| 2022 | $6,454 | $54,100 | $16,600 | $37,500 |
| 2021 | $6,387 | $54,100 | $16,600 | $37,500 |
| 2020 | $6,179 | $54,100 | $16,600 | $37,500 |
| 2019 | $6,020 | $54,100 | $16,600 | $37,500 |
| 2018 | $5,901 | $54,100 | $16,600 | $37,500 |
| 2017 | $5,797 | $54,100 | $16,600 | $37,500 |
| 2016 | $5,346 | $50,300 | $16,600 | $33,700 |
| 2015 | $5,242 | $50,300 | $16,600 | $33,700 |
| 2014 | $5,128 | $50,300 | $16,600 | $33,700 |
Source: Public Records
Map
Nearby Homes