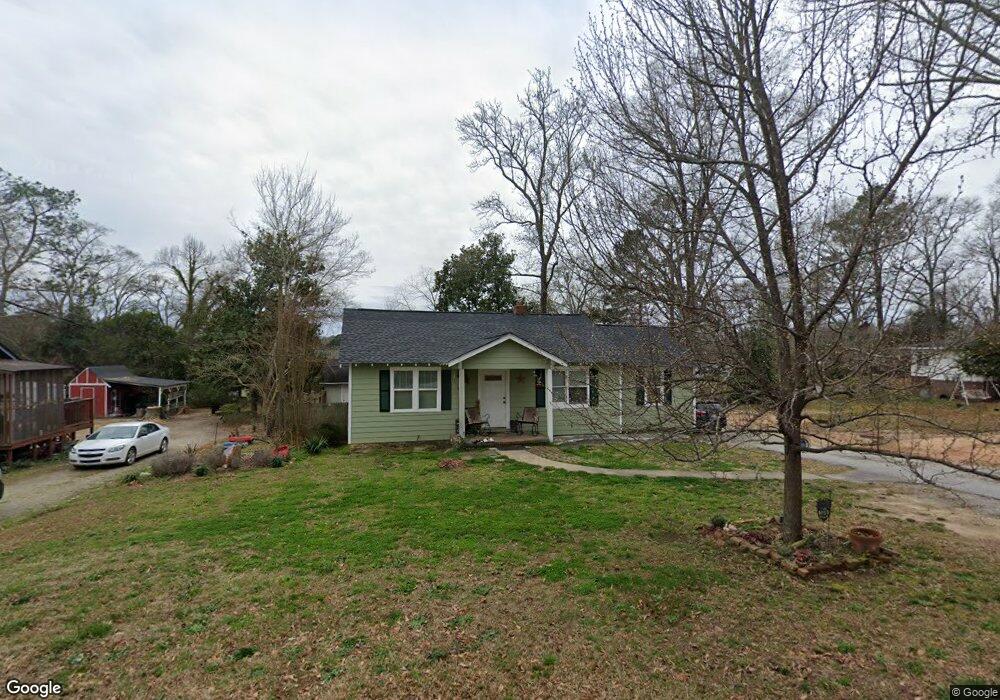
8 Peachtree St Elberton, GA 30635
Estimated Value: $146,852 - $172,000
--
Bed
1
Bath
1,108
Sq Ft
$140/Sq Ft
Est. Value
About This Home
This home is located at 8 Peachtree St, Elberton, GA 30635 and is currently estimated at $154,713, approximately $139 per square foot. 8 Peachtree St is a home located in Elbert County with nearby schools including Elbert County Elementary School, Elbert County Primary School, and Elbert County Middle School.
Ownership History
Date
Name
Owned For
Owner Type
Purchase Details
Closed on
Jan 1, 2024
Sold by
Kirby Corey Bruce
Bought by
Kirby Corey Bruce and Libby Jennifer Lee
Current Estimated Value
Purchase Details
Closed on
Nov 26, 2003
Sold by
Kirby Annie W
Bought by
Kirby Corey Bruce
Purchase Details
Closed on
Mar 28, 2003
Sold by
Household Realty Corporation
Bought by
Kirby Annie W
Purchase Details
Closed on
Jun 4, 2002
Sold by
Johnson Melissa S
Bought by
Household Realty Corporation
Purchase Details
Closed on
Aug 26, 1999
Bought by
Johnson Melissa S
Purchase Details
Closed on
Nov 1, 1993
Purchase Details
Closed on
Jul 1, 1987
Purchase Details
Closed on
Mar 1, 1986
Purchase Details
Closed on
Sep 1, 1981
Purchase Details
Closed on
Nov 1, 1972
Create a Home Valuation Report for This Property
The Home Valuation Report is an in-depth analysis detailing your home's value as well as a comparison with similar homes in the area
Home Values in the Area
Average Home Value in this Area
Purchase History
| Date | Buyer | Sale Price | Title Company |
|---|---|---|---|
| Kirby Corey Bruce | -- | -- | |
| Kirby Corey Bruce | $45,000 | -- | |
| Kirby Annie W | $40,000 | -- | |
| Household Realty Corporation | -- | -- | |
| Johnson Melissa S | -- | -- | |
| -- | $25,000 | -- | |
| -- | -- | -- | |
| -- | $5,000 | -- | |
| -- | $21,000 | -- | |
| -- | $12,500 | -- |
Source: Public Records
Tax History Compared to Growth
Tax History
| Year | Tax Paid | Tax Assessment Tax Assessment Total Assessment is a certain percentage of the fair market value that is determined by local assessors to be the total taxable value of land and additions on the property. | Land | Improvement |
|---|---|---|---|---|
| 2024 | $1,068 | $45,398 | $8,043 | $37,355 |
| 2023 | $1,068 | $45,398 | $8,043 | $37,355 |
| 2022 | $823 | $35,444 | $8,043 | $27,401 |
| 2021 | $829 | $35,444 | $8,043 | $27,401 |
| 2020 | $741 | $28,852 | $8,043 | $20,809 |
| 2019 | $765 | $28,852 | $8,043 | $20,809 |
| 2018 | $781 | $28,852 | $8,043 | $20,809 |
| 2017 | $728 | $25,177 | $8,043 | $17,134 |
| 2016 | $680 | $25,177 | $8,043 | $17,134 |
| 2015 | -- | $25,177 | $8,043 | $17,134 |
| 2014 | -- | $25,177 | $8,043 | $17,134 |
| 2013 | -- | $21,838 | $8,043 | $13,795 |
Source: Public Records
Map
Nearby Homes
- 89 College Ave
- 136 Forest Ave
- 243 W Tate St
- 62 Oak St
- 170 Lake Forest Dr
- 108 Brookhaven Cir
- 968 Ext Elbert St
- 118 Oak Dr
- 0 Oak Dr Unit 7643600
- 0 Oak Dr Unit 10598083
- 143 Lake Forest Cir
- 0 Pulliam St Unit 7659662
- 0 Pulliam St Unit 10616872
- 2790 Cedar Creek Rd
- 381 College Ave
- 345 N Oliver St
- 346 N Oliver St
- 196 S Oliver St
- 270 Dogwood Ln
- 105 S Thomas St
- 10 Peachtree St
- 4 Peachtree St
- 44 Chestnut St
- 5 Peachtree St
- 14 Peachtree St
- 7 Peachtree St
- 40 Chestnut St
- 31 Laurel Dr
- 39 Laurel Dr
- 15 Peachtree St
- 0 Peachtree St Unit 7048443
- 23 Laurel Dr
- 21 Laurel Dr
- 32 Chestnut St
- 141 College Ave
- 147 College Ave
- 155 College Ave
- 32 Laurel Dr
- 151 College Ave
- 17 Laurel Dr