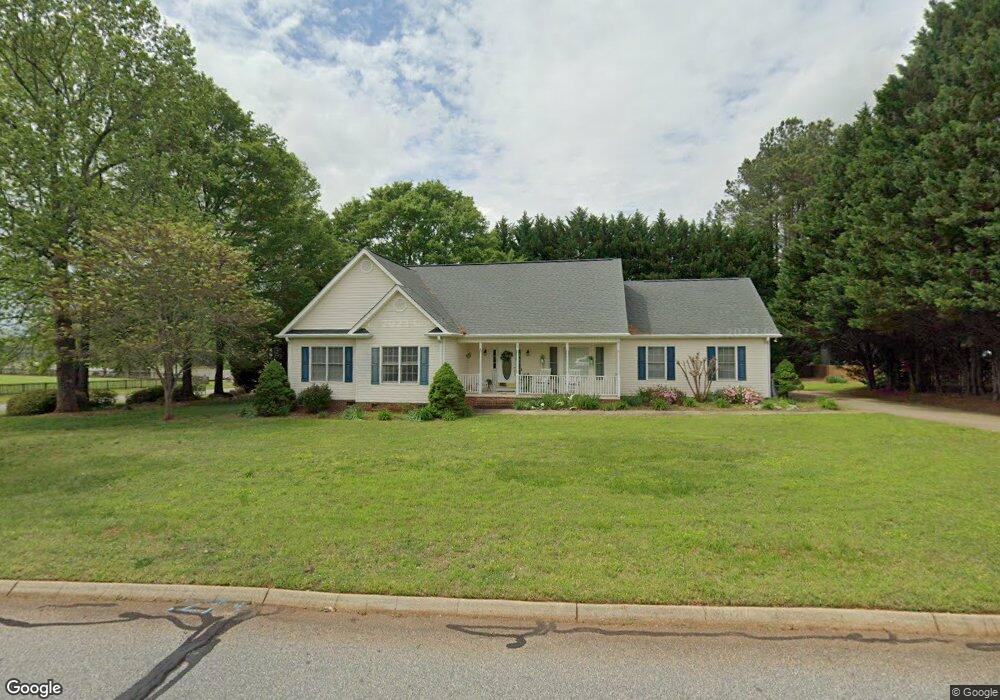
8 Pearle Brook Ln Taylors, SC 29687
Estimated Value: $388,000 - $406,000
3
Beds
2
Baths
1,896
Sq Ft
$210/Sq Ft
Est. Value
About This Home
This home is located at 8 Pearle Brook Ln, Taylors, SC 29687 and is currently estimated at $397,263, approximately $209 per square foot. 8 Pearle Brook Ln is a home located in Greenville County with nearby schools including Mountain View Elementary School, Blue Ridge Middle School, and Blue Ridge High School.
Ownership History
Date
Name
Owned For
Owner Type
Purchase Details
Closed on
Sep 23, 2016
Sold by
Oland Paul A and Oland Pamela L
Bought by
Johnson Angela K and Sceggins Stephen A
Current Estimated Value
Home Financials for this Owner
Home Financials are based on the most recent Mortgage that was taken out on this home.
Original Mortgage
$191,391
Outstanding Balance
$151,334
Interest Rate
3.12%
Mortgage Type
FHA
Estimated Equity
$245,929
Purchase Details
Closed on
Dec 11, 2012
Sold by
Denton Iris Janet
Bought by
Oland Paul A and Oland Pamela L
Home Financials for this Owner
Home Financials are based on the most recent Mortgage that was taken out on this home.
Original Mortgage
$100,000
Interest Rate
3.44%
Mortgage Type
New Conventional
Purchase Details
Closed on
Oct 9, 2008
Sold by
Denton Iris Janet
Bought by
Denton Iris Janet
Purchase Details
Closed on
Apr 26, 2007
Sold by
Denton George N
Bought by
Denton Iris Janet
Purchase Details
Closed on
Dec 8, 1998
Sold by
Arms Danny R
Bought by
Denton George N
Create a Home Valuation Report for This Property
The Home Valuation Report is an in-depth analysis detailing your home's value as well as a comparison with similar homes in the area
Home Values in the Area
Average Home Value in this Area
Purchase History
| Date | Buyer | Sale Price | Title Company |
|---|---|---|---|
| Johnson Angela K | $209,000 | None Available | |
| Oland Paul A | $163,500 | -- | |
| Denton Iris Janet | -- | -- | |
| Denton Iris Janet | -- | None Available | |
| Denton George N | $140,900 | -- |
Source: Public Records
Mortgage History
| Date | Status | Borrower | Loan Amount |
|---|---|---|---|
| Open | Johnson Angela K | $191,391 | |
| Previous Owner | Oland Paul A | $100,000 |
Source: Public Records
Tax History Compared to Growth
Tax History
| Year | Tax Paid | Tax Assessment Tax Assessment Total Assessment is a certain percentage of the fair market value that is determined by local assessors to be the total taxable value of land and additions on the property. | Land | Improvement |
|---|---|---|---|---|
| 2024 | $1,520 | $9,190 | $1,450 | $7,740 |
| 2023 | $1,520 | $9,190 | $1,450 | $7,740 |
| 2022 | $1,417 | $9,190 | $1,450 | $7,740 |
| 2021 | $1,402 | $9,190 | $1,450 | $7,740 |
| 2020 | $1,292 | $7,990 | $1,260 | $6,730 |
| 2019 | $1,284 | $7,990 | $1,260 | $6,730 |
| 2018 | $1,281 | $7,990 | $1,260 | $6,730 |
| 2017 | $1,249 | $7,990 | $1,260 | $6,730 |
| 2016 | $708 | $166,300 | $26,300 | $140,000 |
| 2015 | $708 | $166,300 | $26,300 | $140,000 |
| 2014 | $674 | $160,780 | $18,900 | $141,880 |
Source: Public Records
Map
Nearby Homes
- 108 Brooke Lee Cir
- 15 Otter Ln
- 305 Waters Rd
- 902 Blue Moon St
- 303 Farmers Market St
- 115 Harbor Master Ln
- 514 Coolwater Dr
- 518 Coolwater Dr
- 1331 Groce Meadow Rd
- 537 Coolwater Dr
- 542 Coolwater Dr
- 401 Center Dr
- 104 Sawyer Kyle Way
- 217 Paneer Ln
- Roosevelt Elite Plan at Lakeside at Blue Ridge Plantation
- Ridge Elite Plan at Lakeside at Blue Ridge Plantation
- Hartford Elite Plan at Lakeside at Blue Ridge Plantation
- Emilia Elite Plan at Lakeside at Blue Ridge Plantation
- Converse Elite Plan at Lakeside at Blue Ridge Plantation
- Caterina Elite Plan at Lakeside at Blue Ridge Plantation
- 8 Pearle
- 4 Ferret Dr
- 6 Pearle Brook Ln
- 1 Ferret Dr
- 5 Pearle Brook Ln
- 7 Pearle Brook Ln
- 6 Ferret Dr
- 5 Brook Crest Dr
- 4 Pearle Brook Ln
- 3 Pearle Brook Ln
- 101 Pearle Brook Ln
- 5 Ferret Dr
- 102 Pearle Brook Ln
- 3 Brook Crest Dr
- 4 Sourwood Brook Ct
- 103 Pearle Brook Ln
- 6 Brooke Lee Cir
- 2 Pearle Brook Ln
- 1 Pearle Brook Ln
- 8 Brooke Lee Cir