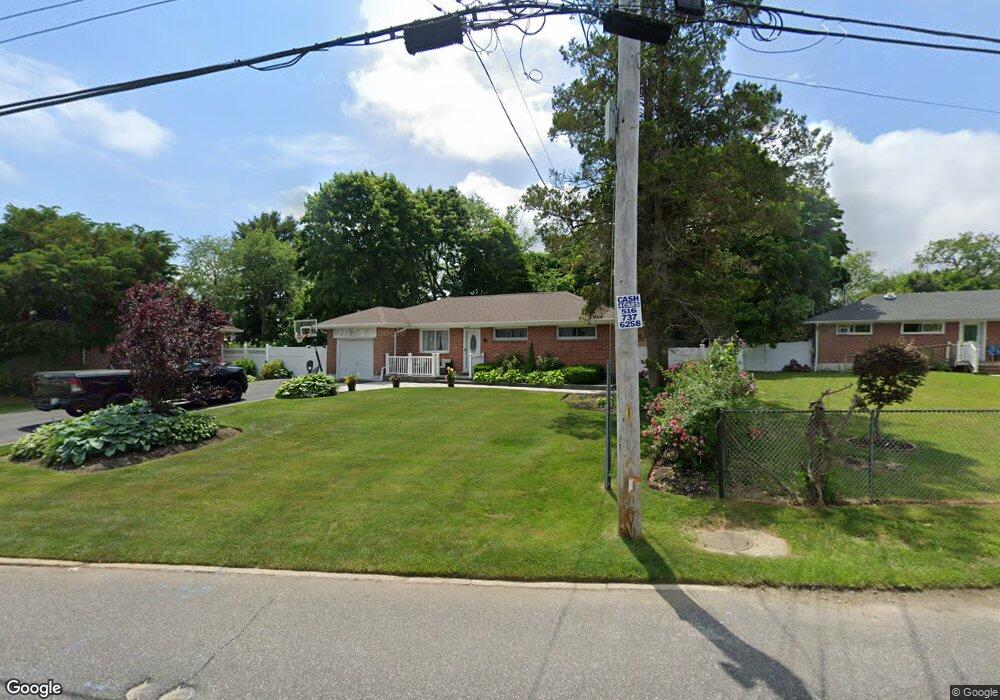
8 Pelham Dr Brentwood, NY 11717
Estimated Value: $592,094 - $735,000
--
Bed
--
Bath
--
Sq Ft
0.41
Acres
About This Home
This home is located at 8 Pelham Dr, Brentwood, NY 11717 and is currently estimated at $669,024. 8 Pelham Dr is a home located in Suffolk County with nearby schools including MDQ Academy.
Ownership History
Date
Name
Owned For
Owner Type
Purchase Details
Closed on
Aug 30, 2010
Sold by
Torres Rosa and Jean Louis Rosa T
Bought by
Tavera Reynaldo and Tavera Erika
Current Estimated Value
Home Financials for this Owner
Home Financials are based on the most recent Mortgage that was taken out on this home.
Original Mortgage
$215,103
Outstanding Balance
$149,474
Interest Rate
5.5%
Mortgage Type
FHA
Estimated Equity
$519,550
Purchase Details
Closed on
Nov 30, 2000
Sold by
Torres Rosa and Jean Louis Rosa T
Bought by
Jean Louis Ludrick D and Jean Louis Rosa T
Home Financials for this Owner
Home Financials are based on the most recent Mortgage that was taken out on this home.
Original Mortgage
$85,000
Interest Rate
6.56%
Mortgage Type
Purchase Money Mortgage
Purchase Details
Closed on
May 29, 1996
Sold by
Jean Louis Demosthenes
Bought by
Torres Rosa
Home Financials for this Owner
Home Financials are based on the most recent Mortgage that was taken out on this home.
Original Mortgage
$19,435
Interest Rate
7.91%
Create a Home Valuation Report for This Property
The Home Valuation Report is an in-depth analysis detailing your home's value as well as a comparison with similar homes in the area
Home Values in the Area
Average Home Value in this Area
Purchase History
| Date | Buyer | Sale Price | Title Company |
|---|---|---|---|
| Tavera Reynaldo | $218,000 | -- | |
| Jean Louis Ludrick D | -- | -- | |
| Torres Rosa | -- | Chicago Title Insurance Co |
Source: Public Records
Mortgage History
| Date | Status | Borrower | Loan Amount |
|---|---|---|---|
| Open | Tavera Reynaldo | $215,103 | |
| Previous Owner | Jean Louis Ludrick D | $85,000 | |
| Previous Owner | Torres Rosa | $19,435 |
Source: Public Records
Tax History Compared to Growth
Tax History
| Year | Tax Paid | Tax Assessment Tax Assessment Total Assessment is a certain percentage of the fair market value that is determined by local assessors to be the total taxable value of land and additions on the property. | Land | Improvement |
|---|---|---|---|---|
| 2024 | $7,082 | $30,900 | $11,800 | $19,100 |
| 2023 | $7,082 | $30,900 | $11,800 | $19,100 |
| 2022 | $6,008 | $30,900 | $11,800 | $19,100 |
| 2021 | $6,008 | $30,900 | $11,800 | $19,100 |
| 2020 | $6,493 | $30,900 | $11,800 | $19,100 |
| 2019 | $6,493 | $0 | $0 | $0 |
| 2018 | -- | $30,900 | $11,800 | $19,100 |
| 2017 | $6,084 | $30,900 | $11,800 | $19,100 |
| 2016 | $6,018 | $30,900 | $11,800 | $19,100 |
| 2015 | -- | $30,900 | $11,800 | $19,100 |
| 2014 | -- | $30,900 | $11,800 | $19,100 |
Source: Public Records
Map
Nearby Homes
- 286 Washington Ave
- 15 Rugby St
- 211 Washington Ave
- 1 W End Ave
- 489 Washington Ave
- 176 Floyd St
- 1304 Express Dr S
- 40 White St
- 31 Perry St
- 189 Vanderbilt Ave
- 43 Franklin St
- 31 Franklin Ave
- 43 Walton St
- 35 Bushwick Ave
- 375 Barleau St
- 44 Lexington Ave
- 140 Floyd St
- 274 Lincoln Ave
- 43 Bushwick Ave
- 4A Ralph Ave