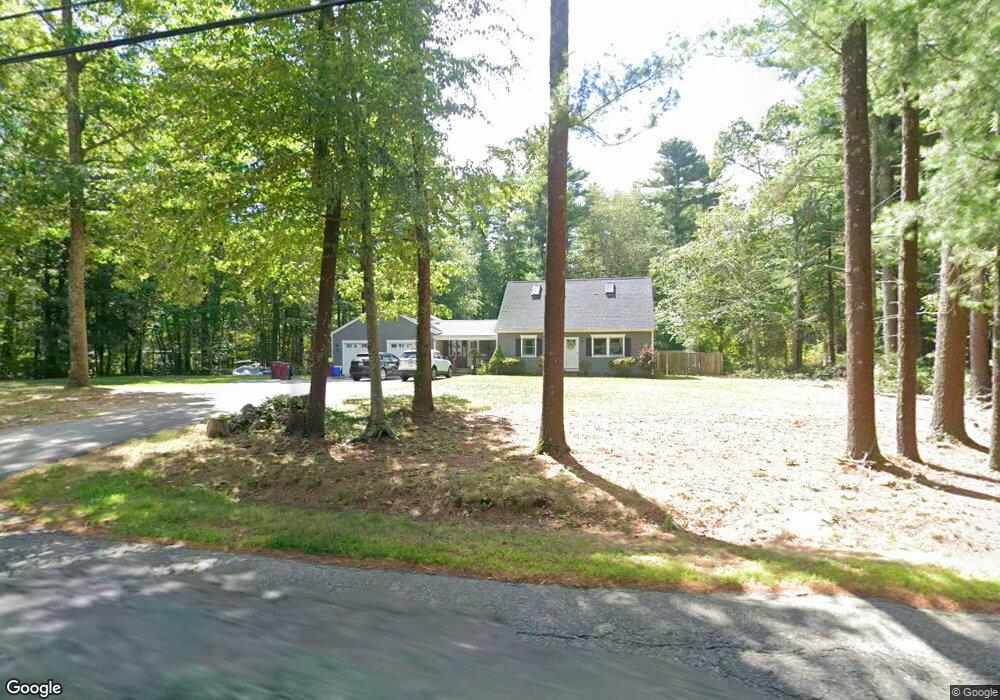
8 Perry St Middleboro, MA 02346
Estimated Value: $618,000 - $730,000
3
Beds
2
Baths
1,806
Sq Ft
$371/Sq Ft
Est. Value
About This Home
This home is located at 8 Perry St, Middleboro, MA 02346 and is currently estimated at $670,470, approximately $371 per square foot. 8 Perry St is a home located in Plymouth County with nearby schools including Mary K. Goode Elementary School.
Ownership History
Date
Name
Owned For
Owner Type
Purchase Details
Closed on
Apr 2, 2023
Sold by
Cunningham Jennifer E
Bought by
Cunningham Alan and Cunningham Jennifer E
Current Estimated Value
Purchase Details
Closed on
Nov 22, 2005
Sold by
Fasula Anthony and Fasula Diane M
Bought by
Bellissimo Jennifer
Home Financials for this Owner
Home Financials are based on the most recent Mortgage that was taken out on this home.
Original Mortgage
$318,000
Interest Rate
6.07%
Mortgage Type
Purchase Money Mortgage
Purchase Details
Closed on
May 27, 2003
Sold by
Destrampe Patrick W and Destrampe Melissa A
Bought by
Fasula Anthony and Fasula Diane M
Home Financials for this Owner
Home Financials are based on the most recent Mortgage that was taken out on this home.
Original Mortgage
$303,145
Interest Rate
5.86%
Mortgage Type
Purchase Money Mortgage
Purchase Details
Closed on
Dec 28, 2000
Sold by
Linhares James N and Linhares Katrin
Bought by
Destrampe Patrick W and Destrampe Melissa A
Create a Home Valuation Report for This Property
The Home Valuation Report is an in-depth analysis detailing your home's value as well as a comparison with similar homes in the area
Home Values in the Area
Average Home Value in this Area
Purchase History
| Date | Buyer | Sale Price | Title Company |
|---|---|---|---|
| Cunningham Alan | -- | None Available | |
| Bellissimo Jennifer | $397,500 | -- | |
| Fasula Anthony | $329,900 | -- | |
| Destrampe Patrick W | $240,900 | -- |
Source: Public Records
Mortgage History
| Date | Status | Borrower | Loan Amount |
|---|---|---|---|
| Previous Owner | Destrampe Patrick W | $318,000 | |
| Previous Owner | Destrampe Patrick W | $303,145 | |
| Previous Owner | Destrampe Patrick W | $192,500 |
Source: Public Records
Tax History
| Year | Tax Paid | Tax Assessment Tax Assessment Total Assessment is a certain percentage of the fair market value that is determined by local assessors to be the total taxable value of land and additions on the property. | Land | Improvement |
|---|---|---|---|---|
| 2025 | $7,292 | $543,800 | $172,000 | $371,800 |
| 2024 | $6,972 | $514,900 | $164,000 | $350,900 |
| 2023 | $6,916 | $485,700 | $164,000 | $321,700 |
| 2022 | $6,195 | $402,800 | $142,400 | $260,400 |
| 2021 | $6,184 | $380,100 | $124,800 | $255,300 |
| 2020 | $5,882 | $370,400 | $124,800 | $245,600 |
| 2019 | $5,307 | $342,800 | $124,800 | $218,000 |
| 2018 | $5,354 | $343,200 | $118,600 | $224,600 |
| 2017 | $5,114 | $324,300 | $114,000 | $210,300 |
| 2016 | $4,731 | $297,200 | $108,000 | $189,200 |
| 2015 | $4,619 | $292,700 | $108,000 | $184,700 |
Source: Public Records
Map
Nearby Homes
- 167 Old Miller St
- 146 Miller St
- 80 Walnut St
- 53 Miller St
- 480 Wareham St
- Rear Wareham St
- 441 Wareham St
- 386 Wareham St
- 57 Long Point Rd Unit 208
- 57 Long Point Rd Unit 104
- 425 Wareham St
- 124 Ashley Ln Unit 12-4
- 28 Wareham St
- 37 Rocky Gutter St
- 295 Cherry St
- 47 Faye Ave
- 558 Wareham St
- 13 Pine Bluff
- 162 E Grove St
- 571 Wareham St
Your Personal Tour Guide
Ask me questions while you tour the home.