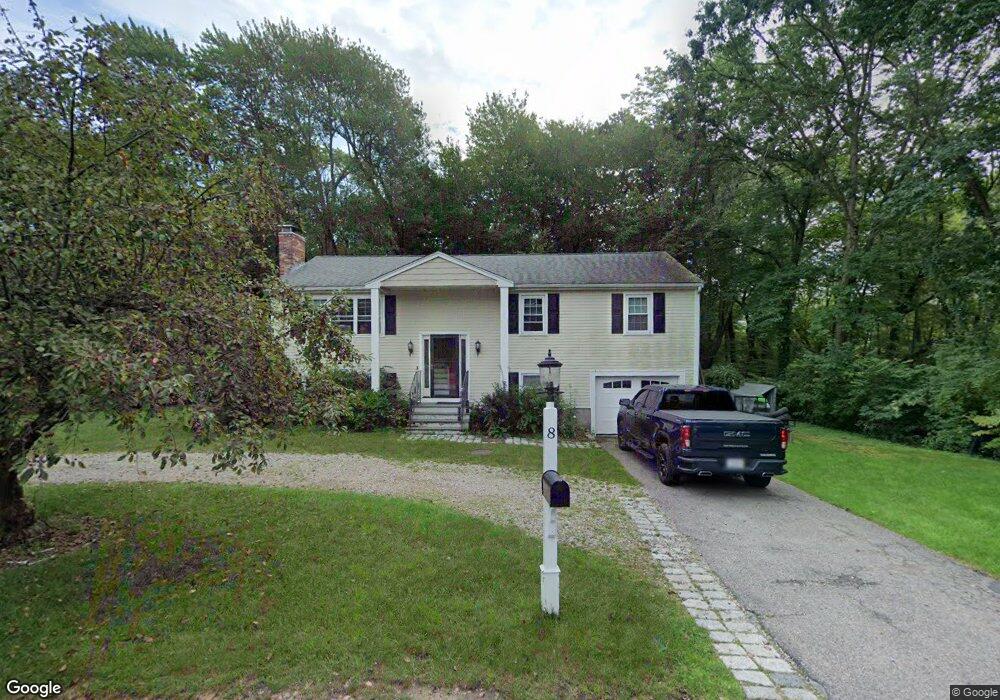
8 Pierce St Walpole, MA 02081
Estimated Value: $623,000 - $655,000
3
Beds
2
Baths
1,196
Sq Ft
$532/Sq Ft
Est. Value
About This Home
This home is located at 8 Pierce St, Walpole, MA 02081 and is currently estimated at $636,842, approximately $532 per square foot. 8 Pierce St is a home located in Norfolk County with nearby schools including Fisher School, Walpole Middle School, and Walpole High School.
Ownership History
Date
Name
Owned For
Owner Type
Purchase Details
Closed on
Jun 30, 2017
Sold by
Smith Robert E and Smith Pauline A
Bought by
Hazeldine James F and Hazeldine Jaclyn B
Current Estimated Value
Home Financials for this Owner
Home Financials are based on the most recent Mortgage that was taken out on this home.
Original Mortgage
$394,250
Outstanding Balance
$328,719
Interest Rate
4.02%
Mortgage Type
New Conventional
Estimated Equity
$308,123
Purchase Details
Closed on
Oct 30, 2007
Sold by
Smith Pauline A
Bought by
Smith Pauline A and Smith Robert E
Create a Home Valuation Report for This Property
The Home Valuation Report is an in-depth analysis detailing your home's value as well as a comparison with similar homes in the area
Home Values in the Area
Average Home Value in this Area
Purchase History
| Date | Buyer | Sale Price | Title Company |
|---|---|---|---|
| Hazeldine James F | $415,000 | -- | |
| Smith Pauline A | -- | -- |
Source: Public Records
Mortgage History
| Date | Status | Borrower | Loan Amount |
|---|---|---|---|
| Open | Hazeldine James F | $394,250 |
Source: Public Records
Tax History Compared to Growth
Tax History
| Year | Tax Paid | Tax Assessment Tax Assessment Total Assessment is a certain percentage of the fair market value that is determined by local assessors to be the total taxable value of land and additions on the property. | Land | Improvement |
|---|---|---|---|---|
| 2025 | $7,124 | $555,300 | $289,400 | $265,900 |
| 2024 | $6,964 | $526,800 | $278,300 | $248,500 |
| 2023 | $6,671 | $480,300 | $242,000 | $238,300 |
| 2022 | $6,309 | $436,300 | $224,100 | $212,200 |
| 2021 | $6,071 | $409,100 | $211,400 | $197,700 |
| 2020 | $6,053 | $403,800 | $199,400 | $204,400 |
| 2019 | $5,839 | $386,700 | $191,800 | $194,900 |
| 2018 | $5,497 | $360,000 | $184,700 | $175,300 |
| 2017 | $5,313 | $346,600 | $177,500 | $169,100 |
| 2016 | $5,169 | $332,200 | $170,700 | $161,500 |
| 2015 | $4,955 | $315,600 | $162,400 | $153,200 |
| 2014 | $4,717 | $299,300 | $162,400 | $136,900 |
Source: Public Records
Map
Nearby Homes
- 4 Kendall St
- 65-67 Diamond St
- 9 Grist Mill Ln
- 22 Holly Rd
- 103 Centre Ln
- 305 Centre Ln
- 291 Plimpton St
- 9 Greenwood Rd Unit 11
- 2 Alexandra Way
- 12 Thomas St
- 16 Burrill St
- 1188 Main St
- 61 Alton St
- 24 Pelican Dr
- 8 Old Fisher Ln
- 49 Hound Pack Cir
- 1165 Washington St
- 158 Clear Pond Dr Unit 158
- 75 Emerson Rd
- 0 Old Post Rd