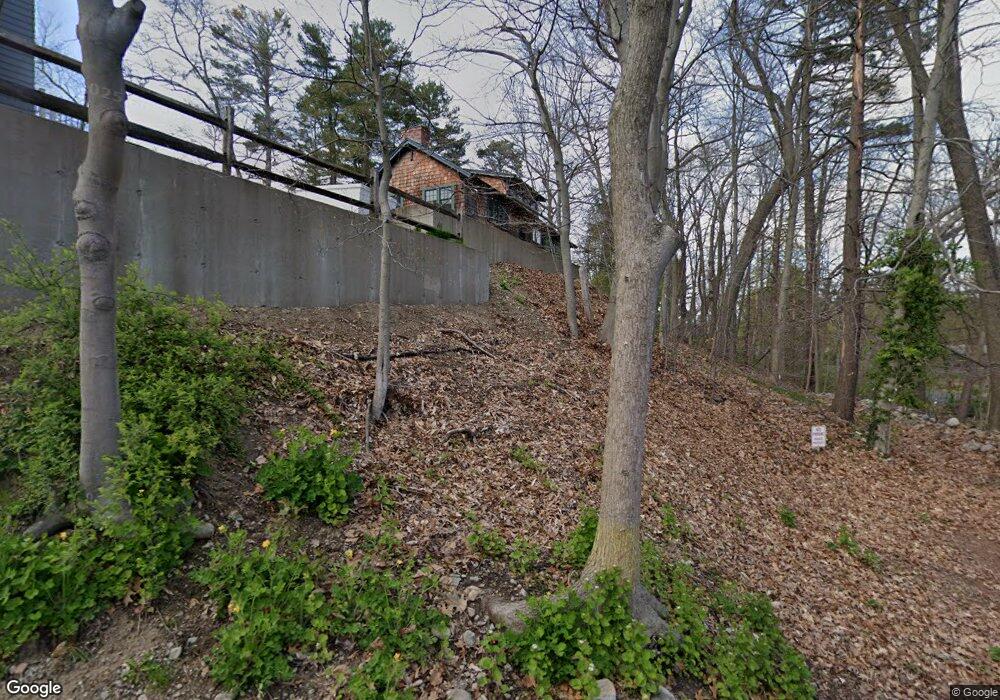
8 Pine Rd Wayland, MA 01778
Estimated Value: $1,206,000 - $1,451,000
3
Beds
2
Baths
2,508
Sq Ft
$523/Sq Ft
Est. Value
About This Home
This home is located at 8 Pine Rd, Wayland, MA 01778 and is currently estimated at $1,310,431, approximately $522 per square foot. 8 Pine Rd is a home located in Middlesex County with nearby schools including Wayland High School and Veritas Christian Academy.
Ownership History
Date
Name
Owned For
Owner Type
Purchase Details
Closed on
Feb 28, 2001
Sold by
Mason Sandra E
Bought by
Johnson Peter and Johnson Jeffrey Elizabeth
Current Estimated Value
Purchase Details
Closed on
Oct 1, 1997
Sold by
Poldar Rt and Darack
Bought by
Johnson Peter and Johnson Jeffery Elizabeth
Purchase Details
Closed on
Nov 27, 1989
Sold by
Rich Paul S
Bought by
Poldar Rt
Create a Home Valuation Report for This Property
The Home Valuation Report is an in-depth analysis detailing your home's value as well as a comparison with similar homes in the area
Home Values in the Area
Average Home Value in this Area
Purchase History
| Date | Buyer | Sale Price | Title Company |
|---|---|---|---|
| Johnson Peter | $46,250 | -- | |
| Johnson Peter | $185,000 | -- | |
| Poldar Rt | $130,000 | -- |
Source: Public Records
Mortgage History
| Date | Status | Borrower | Loan Amount |
|---|---|---|---|
| Open | Poldar Rt | $417,000 | |
| Closed | Poldar Rt | $417,000 | |
| Closed | Poldar Rt | $417,000 |
Source: Public Records
Tax History
| Year | Tax Paid | Tax Assessment Tax Assessment Total Assessment is a certain percentage of the fair market value that is determined by local assessors to be the total taxable value of land and additions on the property. | Land | Improvement |
|---|---|---|---|---|
| 2025 | $20,518 | $1,312,700 | $700,400 | $612,300 |
| 2024 | $19,420 | $1,251,300 | $666,900 | $584,400 |
| 2023 | $18,483 | $1,110,100 | $606,200 | $503,900 |
| 2022 | $17,627 | $960,600 | $469,100 | $491,500 |
| 2021 | $16,551 | $893,700 | $405,300 | $488,400 |
| 2020 | $14,883 | $838,000 | $360,300 | $477,700 |
| 2019 | $15,072 | $824,500 | $343,200 | $481,300 |
| 2018 | $13,744 | $762,300 | $343,200 | $419,100 |
| 2017 | $13,184 | $726,800 | $326,700 | $400,100 |
| 2016 | $12,461 | $718,600 | $320,300 | $398,300 |
| 2015 | $12,820 | $697,100 | $320,300 | $376,800 |
Source: Public Records
Map
Nearby Homes
- 108 Dudley Rd
- 123 Dudley Rd
- 22 Lake Shore Dr
- 26 Pine Ridge Rd
- 22 Pine Ridge Rd
- 186 Main St
- 138 W Plain St
- 45 W Plain St Unit 1
- 454 Old Connecticut Path
- 16 Castle Rd
- 85 Lake Road Terrace
- 1 Cole Rd
- 136 Commonwealth Rd
- 218 Old Connecticut Path
- 18 Brigati Terrace
- 5 Griffin Cir
- 18 Jay Dr
- 340 N Main St
- 6 Brewster Rd
- 189 Danforth St
Your Personal Tour Guide
Ask me questions while you tour the home.