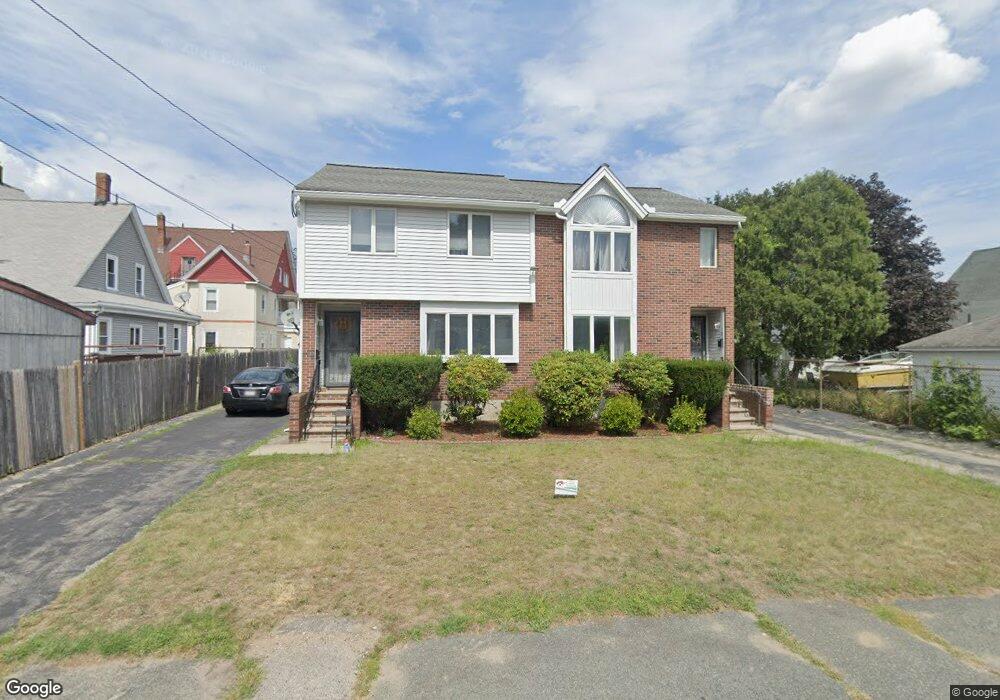
8 Plain St Unit A Quincy, MA 02169
South Quincy NeighborhoodEstimated Value: $773,000 - $1,130,000
2
Beds
2
Baths
1,250
Sq Ft
$769/Sq Ft
Est. Value
About This Home
This home is located at 8 Plain St Unit A, Quincy, MA 02169 and is currently estimated at $961,004, approximately $768 per square foot. 8 Plain St Unit A is a home located in Norfolk County with nearby schools including South West Middle School, Lincoln-Hancock Community School, and Quincy High School.
Ownership History
Date
Name
Owned For
Owner Type
Purchase Details
Closed on
Aug 8, 1989
Sold by
Pizzi Colette
Bought by
Tung Cheung M
Current Estimated Value
Home Financials for this Owner
Home Financials are based on the most recent Mortgage that was taken out on this home.
Original Mortgage
$212,250
Interest Rate
10%
Mortgage Type
Purchase Money Mortgage
Create a Home Valuation Report for This Property
The Home Valuation Report is an in-depth analysis detailing your home's value as well as a comparison with similar homes in the area
Home Values in the Area
Average Home Value in this Area
Purchase History
| Date | Buyer | Sale Price | Title Company |
|---|---|---|---|
| Tung Cheung M | $283,000 | -- |
Source: Public Records
Mortgage History
| Date | Status | Borrower | Loan Amount |
|---|---|---|---|
| Closed | Tung Cheung M | $160,000 | |
| Closed | Tung Cheung M | $212,250 |
Source: Public Records
Tax History Compared to Growth
Tax History
| Year | Tax Paid | Tax Assessment Tax Assessment Total Assessment is a certain percentage of the fair market value that is determined by local assessors to be the total taxable value of land and additions on the property. | Land | Improvement |
|---|---|---|---|---|
| 2025 | $9,396 | $814,900 | $299,300 | $515,600 |
| 2024 | $8,859 | $786,100 | $285,000 | $501,100 |
| 2023 | $8,822 | $785,800 | $259,100 | $526,700 |
| 2022 | $8,694 | $725,700 | $215,800 | $509,900 |
| 2021 | $8,188 | $674,500 | $215,800 | $458,700 |
| 2020 | $8,608 | $692,500 | $215,800 | $476,700 |
| 2019 | $7,571 | $603,300 | $203,700 | $399,600 |
| 2018 | $7,529 | $564,400 | $188,600 | $375,800 |
| 2017 | $7,776 | $548,800 | $179,600 | $369,200 |
| 2016 | $6,838 | $476,200 | $156,200 | $320,000 |
| 2015 | $6,697 | $458,700 | $156,200 | $302,500 |
| 2014 | $5,742 | $386,400 | $156,200 | $230,200 |
Source: Public Records
Map
Nearby Homes
- 347 Centre St
- 21 Totman St Unit 202
- 21 Totman St Unit 309
- 21 Totman St Unit Model-1
- 21 Totman St Unit 209
- 21 Totman St Unit 203
- 21 Totman St Unit 2
- 56 Penn St Unit 4
- 118 Brook Rd Unit 2
- 72 Federal Ave
- 192 Federal Ave Unit B
- 94 Brook Rd Unit 3
- 177 Franklin St
- 9 Independence Ave Unit 307
- 8 Jackson St Unit B2
- 51 Brook Rd
- 50 N Payne St Unit 1
- 50 N Payne St Unit 3
- 64 Garfield St Unit B
- 91 Garfield St
- 10 Plain St
- 10 Plain St Unit 10
- 10 Plain St
- 10 Plain St Unit 1
- 8 Plain St
- 68 Trafford St
- 197 Liberty St
- 64 Trafford St
- 64 Trafford St Unit 4
- 64 Trafford St Unit 5
- 64 Trafford St Unit 2
- 64 Trafford St Unit 1
- 64 Trafford St Unit 6
- 64 Trafford St Unit 3
- 193 Liberty St
- 7 Plain St
- 80 Trafford St Unit 2
- 80 Trafford St Unit 1
- 207 Liberty St
- 60 Trafford St Unit 1