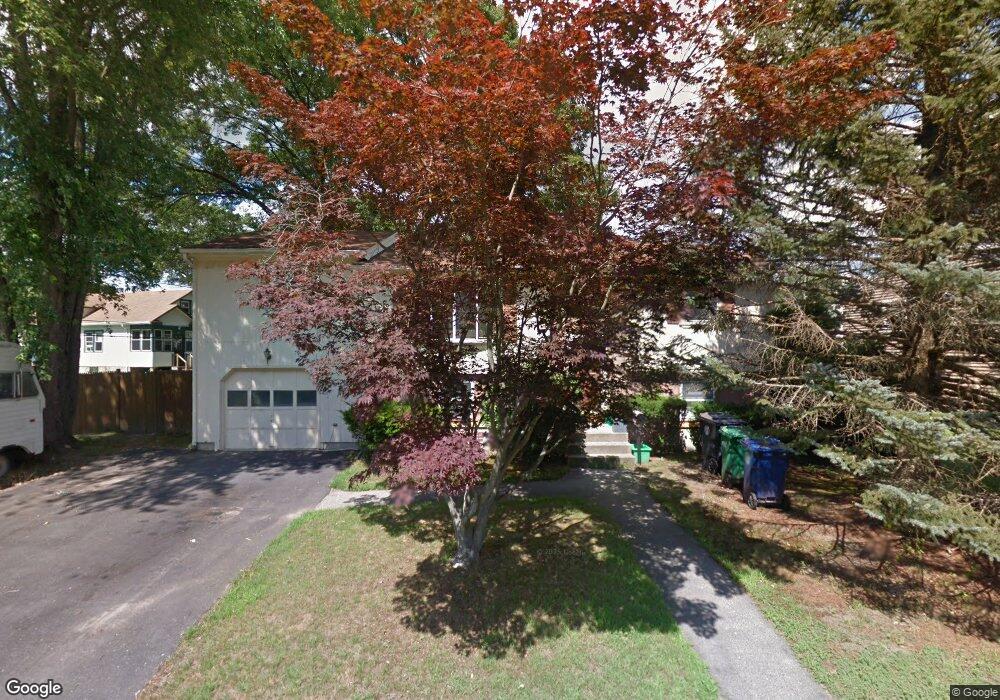
8 Poplar Ave Warwick, RI 02889
Conimicut-Shawomet NeighborhoodEstimated Value: $361,000 - $417,000
3
Beds
1
Bath
1,227
Sq Ft
$328/Sq Ft
Est. Value
About This Home
This home is located at 8 Poplar Ave, Warwick, RI 02889 and is currently estimated at $402,445, approximately $327 per square foot. 8 Poplar Ave is a home located in Kent County with nearby schools including Saint Kevin School and Bishop Hendricken High School.
Ownership History
Date
Name
Owned For
Owner Type
Purchase Details
Closed on
Oct 19, 2021
Sold by
Kulz Barbara A
Bought by
Barbara A Kulz Rlty Lt and Kulz
Current Estimated Value
Purchase Details
Closed on
Jul 25, 1989
Sold by
Luth Frederick E
Bought by
Kulz George A
Home Financials for this Owner
Home Financials are based on the most recent Mortgage that was taken out on this home.
Original Mortgage
$105,000
Interest Rate
10.07%
Mortgage Type
Purchase Money Mortgage
Create a Home Valuation Report for This Property
The Home Valuation Report is an in-depth analysis detailing your home's value as well as a comparison with similar homes in the area
Home Values in the Area
Average Home Value in this Area
Purchase History
| Date | Buyer | Sale Price | Title Company |
|---|---|---|---|
| Barbara A Kulz Rlty Lt | -- | None Available | |
| Kulz George A | $110,000 | -- |
Source: Public Records
Mortgage History
| Date | Status | Borrower | Loan Amount |
|---|---|---|---|
| Previous Owner | Kulz George A | $105,000 |
Source: Public Records
Tax History Compared to Growth
Tax History
| Year | Tax Paid | Tax Assessment Tax Assessment Total Assessment is a certain percentage of the fair market value that is determined by local assessors to be the total taxable value of land and additions on the property. | Land | Improvement |
|---|---|---|---|---|
| 2024 | $4,546 | $314,200 | $99,100 | $215,100 |
| 2023 | $4,458 | $314,200 | $99,100 | $215,100 |
| 2022 | $4,147 | $221,400 | $59,600 | $161,800 |
| 2021 | $4,147 | $221,400 | $59,600 | $161,800 |
| 2020 | $4,147 | $221,400 | $59,600 | $161,800 |
| 2019 | $4,147 | $221,400 | $59,600 | $161,800 |
| 2018 | $3,781 | $181,800 | $59,600 | $122,200 |
| 2017 | $3,680 | $181,800 | $59,600 | $122,200 |
| 2016 | $3,680 | $181,800 | $59,600 | $122,200 |
| 2015 | $3,498 | $168,600 | $56,400 | $112,200 |
| 2014 | $3,382 | $168,600 | $56,400 | $112,200 |
| 2013 | $3,337 | $168,600 | $56,400 | $112,200 |
Source: Public Records
Map
Nearby Homes