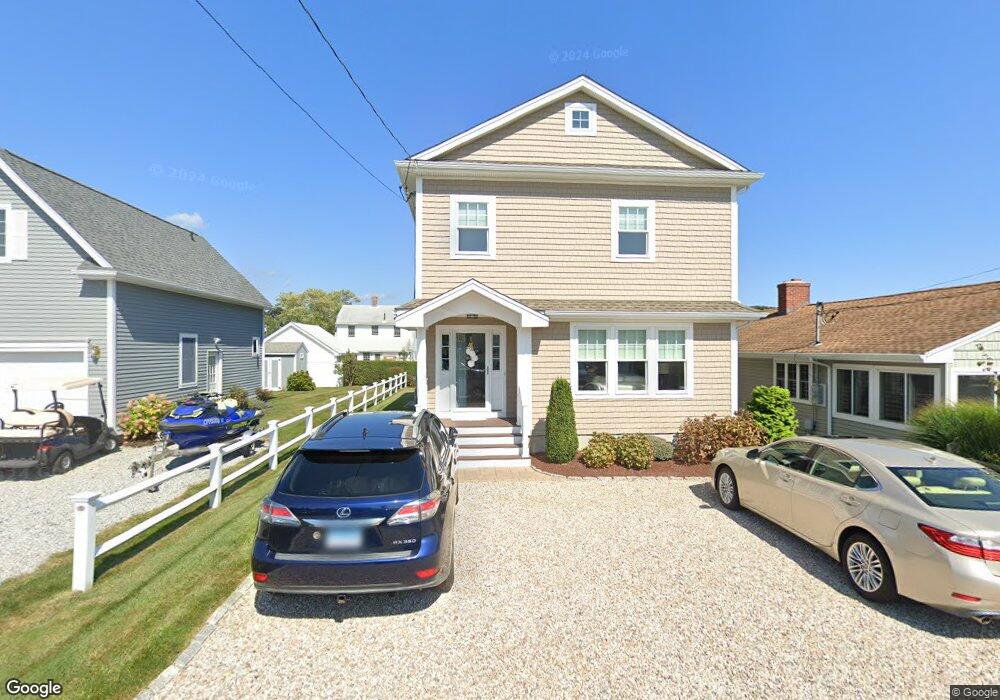
8 Pratt Rd Old Saybrook, CT 06475
Estimated Value: $981,000 - $1,139,000
3
Beds
3
Baths
1,944
Sq Ft
$555/Sq Ft
Est. Value
About This Home
This home is located at 8 Pratt Rd, Old Saybrook, CT 06475 and is currently estimated at $1,079,482, approximately $555 per square foot. 8 Pratt Rd is a home located in Middlesex County with nearby schools including Kathleen E. Goodwin School, Old Saybrook Middle School, and Old Saybrook Senior High School.
Ownership History
Date
Name
Owned For
Owner Type
Purchase Details
Closed on
Nov 19, 2020
Sold by
Staislawscyk Francis and Stanislawscyk Rita
Bought by
Stanislawscyk T
Current Estimated Value
Purchase Details
Closed on
Mar 3, 2003
Sold by
Danby Maribeth P
Bought by
Stanislawiscz Francis and Stanislawiscz Rita
Purchase Details
Closed on
Aug 23, 1993
Sold by
Peoples Sb New Britain
Bought by
Danby Kevin J
Create a Home Valuation Report for This Property
The Home Valuation Report is an in-depth analysis detailing your home's value as well as a comparison with similar homes in the area
Home Values in the Area
Average Home Value in this Area
Purchase History
| Date | Buyer | Sale Price | Title Company |
|---|---|---|---|
| Stanislawscyk T | -- | None Available | |
| Stanislawiscz Francis | $335,000 | -- | |
| Danby Kevin J | $85,500 | -- |
Source: Public Records
Mortgage History
| Date | Status | Borrower | Loan Amount |
|---|---|---|---|
| Previous Owner | Danby Kevin J | $50,000 | |
| Previous Owner | Danby Kevin J | $185,000 | |
| Previous Owner | Danby Kevin J | $194,500 |
Source: Public Records
Tax History Compared to Growth
Tax History
| Year | Tax Paid | Tax Assessment Tax Assessment Total Assessment is a certain percentage of the fair market value that is determined by local assessors to be the total taxable value of land and additions on the property. | Land | Improvement |
|---|---|---|---|---|
| 2025 | $9,106 | $587,500 | $281,000 | $306,500 |
| 2024 | $8,930 | $587,500 | $281,000 | $306,500 |
| 2023 | $7,528 | $368,100 | $154,900 | $213,200 |
| 2022 | $7,391 | $368,100 | $154,900 | $213,200 |
| 2021 | $7,380 | $368,100 | $154,900 | $213,200 |
| 2020 | $7,380 | $368,100 | $154,900 | $213,200 |
| 2019 | $7,270 | $368,100 | $154,900 | $213,200 |
| 2018 | $8,316 | $424,300 | $161,100 | $263,200 |
| 2017 | $8,342 | $424,300 | $161,100 | $263,200 |
| 2016 | $5,325 | $276,500 | $161,100 | $115,400 |
| 2015 | $5,201 | $276,500 | $161,100 | $115,400 |
| 2014 | $5,115 | $276,500 | $161,100 | $115,400 |
Source: Public Records
Map
Nearby Homes