Estimated Value: $1,032,077 - $1,205,000
5
Beds
4
Baths
2,672
Sq Ft
$424/Sq Ft
Est. Value
About This Home
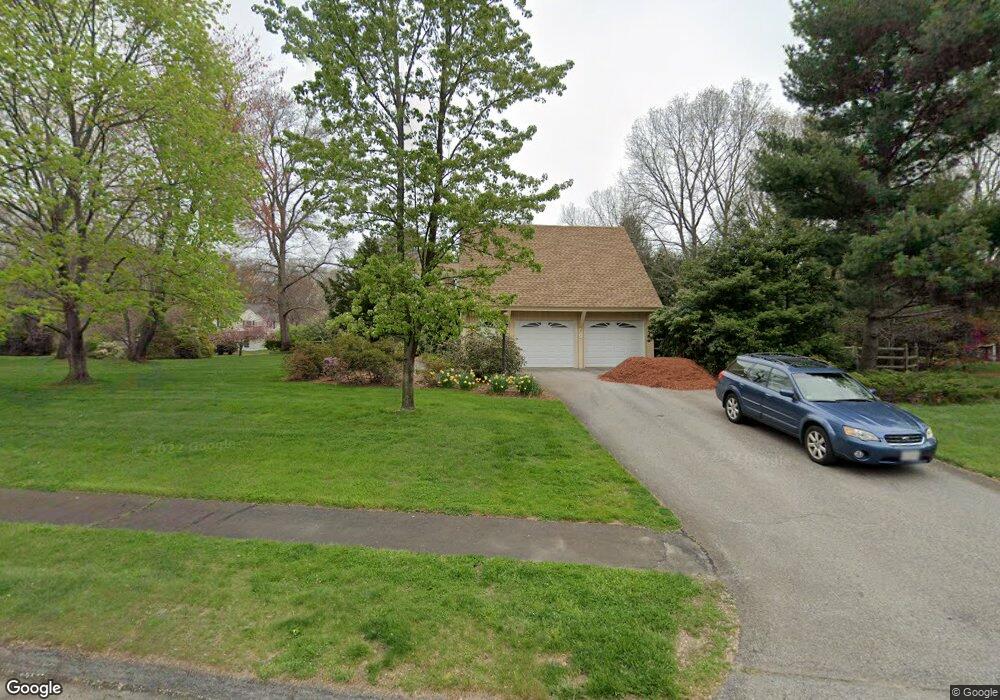
This home is located at 8 Putter Dr, Acton, MA 01720 and is currently estimated at $1,132,019, approximately $423 per square foot. 8 Putter Dr is a home located in Middlesex County with nearby schools including Acton-Boxborough Regional High School, Maynard Knowledge Beginnings, and The Imago School.
Ownership History
Date
Name
Owned For
Owner Type
Purchase Details
Closed on
Apr 16, 1987
Sold by
Warter Lawrence C
Bought by
Smith G Michael
Current Estimated Value
Home Financials for this Owner
Home Financials are based on the most recent Mortgage that was taken out on this home.
Original Mortgage
$153,100
Interest Rate
8.97%
Mortgage Type
Purchase Money Mortgage
Create a Home Valuation Report for This Property
The Home Valuation Report is an in-depth analysis detailing your home's value as well as a comparison with similar homes in the area
Home Values in the Area
Average Home Value in this Area
Purchase History
| Date | Buyer | Sale Price | Title Company |
|---|---|---|---|
| Smith G Michael | $352,000 | -- |
Source: Public Records
Mortgage History
| Date | Status | Borrower | Loan Amount |
|---|---|---|---|
| Closed | Smith G Michael | $113,000 | |
| Closed | Smith G Michael | $153,100 |
Source: Public Records
Tax History
| Year | Tax Paid | Tax Assessment Tax Assessment Total Assessment is a certain percentage of the fair market value that is determined by local assessors to be the total taxable value of land and additions on the property. | Land | Improvement |
|---|---|---|---|---|
| 2025 | $17,148 | $999,900 | $385,700 | $614,200 |
| 2024 | $16,023 | $961,200 | $385,700 | $575,500 |
| 2023 | $15,627 | $889,900 | $350,400 | $539,500 |
| 2022 | $15,043 | $773,400 | $305,200 | $468,200 |
| 2021 | $14,673 | $725,300 | $281,800 | $443,500 |
| 2020 | $13,837 | $719,200 | $281,800 | $437,400 |
| 2019 | $13,340 | $688,700 | $281,800 | $406,900 |
| 2018 | $13,099 | $675,900 | $281,800 | $394,100 |
| 2017 | $12,963 | $680,100 | $281,800 | $398,300 |
| 2016 | $12,701 | $660,500 | $281,800 | $378,700 |
| 2015 | $12,504 | $656,400 | $281,800 | $374,600 |
| 2014 | $12,057 | $619,900 | $281,800 | $338,100 |
Source: Public Records
Map
Nearby Homes
- 63 Conant St
- 36 Brown St
- 12 Brown St
- 70 Powder Mill Rd
- 68 Powder Mill Rd
- 66 Powder Mill Rd
- 23 Deer Path Unit 5
- 1 Drummer Rd Unit A5
- 22 Douglas Ave Unit 2
- 22 Douglas Ave Unit 1
- 30 Brewster Ln
- 128 Parker St Unit 3B
- 31 Drummer Rd Unit 31
- 40 High St
- 5 Hayes St Unit 5
- 13 Arthur St Unit 15
- 31-33 Roosevelt St
- 96 Forest Ridge Rd Unit 96
- 1 Vanderbelt Rd
- 70 River St
Your Personal Tour Guide
Ask me questions while you tour the home.