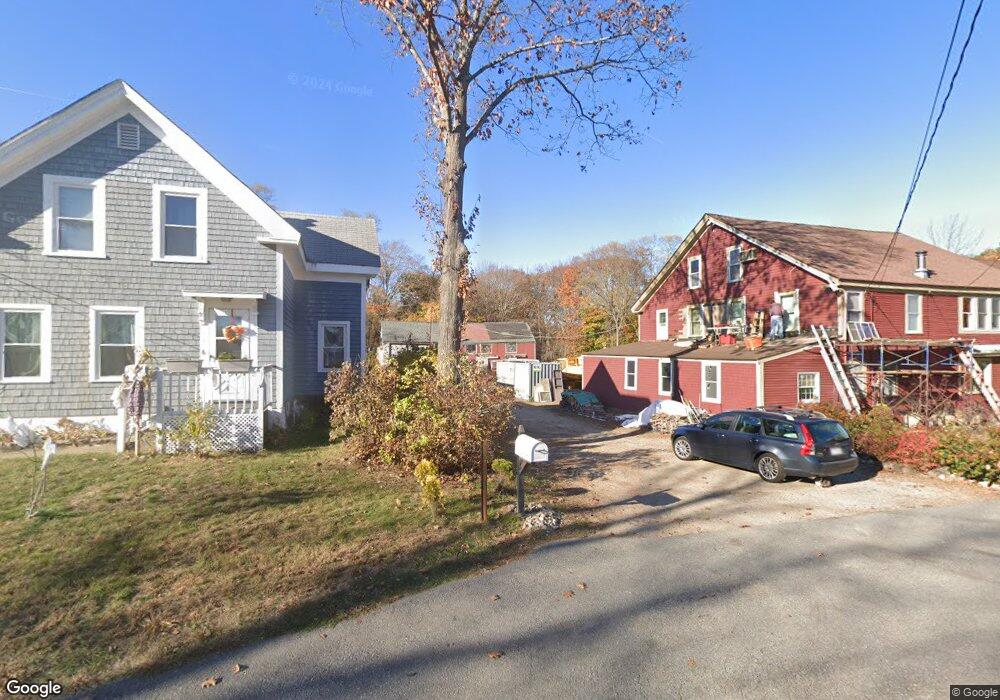
8 Railroad Ave Merrimac, MA 01860
Estimated Value: $519,799
2
Beds
1
Bath
5,320
Sq Ft
$98/Sq Ft
Est. Value
About This Home
This home is located at 8 Railroad Ave, Merrimac, MA 01860 and is currently priced at $519,799, approximately $97 per square foot. 8 Railroad Ave is a home located in Essex County with nearby schools including Pentucket Regional High School.
Ownership History
Date
Name
Owned For
Owner Type
Purchase Details
Closed on
Jun 1, 1995
Sold by
Tilton Marcia L
Bought by
Rosenberg Rhoda
Current Estimated Value
Purchase Details
Closed on
Feb 14, 1995
Sold by
Est Girroir Harry and Tilton Marcia
Bought by
Est Girroir Harry and Tilton Marcia
Purchase Details
Closed on
Sep 18, 1992
Sold by
Est Harry B Girroir
Bought by
Baxter Alan E and Baxter Carol A
Create a Home Valuation Report for This Property
The Home Valuation Report is an in-depth analysis detailing your home's value as well as a comparison with similar homes in the area
Home Values in the Area
Average Home Value in this Area
Purchase History
| Date | Buyer | Sale Price | Title Company |
|---|---|---|---|
| Rosenberg Rhoda | $137,000 | -- | |
| Rosenberg Rhoda | $137,000 | -- | |
| Est Girroir Harry | $75,000 | -- | |
| Girroir Harry Est | $75,000 | -- | |
| Baxter Alan E | $150,000 | -- | |
| Baxter Alan E | $150,000 | -- |
Source: Public Records
Mortgage History
| Date | Status | Borrower | Loan Amount |
|---|---|---|---|
| Open | Baxter Alan E | $50,000 | |
| Closed | Baxter Alan E | $30,000 |
Source: Public Records
Tax History Compared to Growth
Tax History
| Year | Tax Paid | Tax Assessment Tax Assessment Total Assessment is a certain percentage of the fair market value that is determined by local assessors to be the total taxable value of land and additions on the property. | Land | Improvement |
|---|---|---|---|---|
| 2025 | $10,674 | $805,600 | $267,600 | $538,000 |
| 2024 | $10,565 | $782,600 | $267,600 | $515,000 |
| 2023 | $9,908 | $670,800 | $224,000 | $446,800 |
| 2022 | $10,038 | $614,300 | $191,300 | $423,000 |
| 2021 | $9,359 | $574,200 | $171,700 | $402,500 |
| 2020 | $7,221 | $485,300 | $171,700 | $313,600 |
| 2019 | $7,331 | $463,700 | $165,200 | $298,500 |
| 2018 | $7,395 | $469,200 | $165,200 | $304,000 |
| 2017 | $7,417 | $453,900 | $149,900 | $304,000 |
| 2016 | $6,299 | $389,800 | $149,900 | $239,900 |
| 2015 | $5,631 | $346,500 | $149,900 | $196,600 |
| 2014 | $6,060 | $381,400 | $149,900 | $231,500 |
Source: Public Records
Map
Nearby Homes