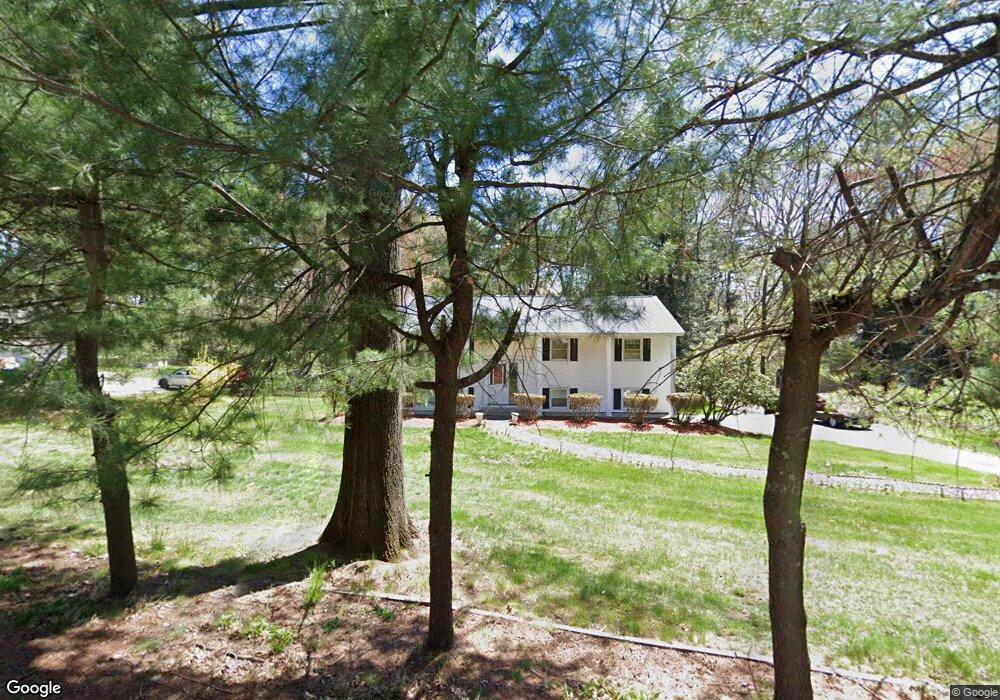
8 Ranlett Ln Unit 8 Billerica, MA 01821
Estimated Value: $663,919 - $822,000
3
Beds
2
Baths
1,602
Sq Ft
$447/Sq Ft
Est. Value
About This Home
This home is located at 8 Ranlett Ln Unit 8, Billerica, MA 01821 and is currently estimated at $715,730, approximately $446 per square foot. 8 Ranlett Ln Unit 8 is a home located in Middlesex County with nearby schools including Billerica Memorial High School and Knowledge Beginnings South.
Ownership History
Date
Name
Owned For
Owner Type
Purchase Details
Closed on
Nov 18, 2013
Sold by
Chen John W
Bought by
John W Chen T and Chen John W
Current Estimated Value
Purchase Details
Closed on
Oct 26, 2012
Sold by
Prola Timothy J
Bought by
Chen John W
Home Financials for this Owner
Home Financials are based on the most recent Mortgage that was taken out on this home.
Original Mortgage
$226,900
Interest Rate
3.56%
Mortgage Type
New Conventional
Purchase Details
Closed on
Dec 28, 1994
Sold by
Proia Antonio and Proia Katherine
Bought by
Proia Timothy J
Create a Home Valuation Report for This Property
The Home Valuation Report is an in-depth analysis detailing your home's value as well as a comparison with similar homes in the area
Home Values in the Area
Average Home Value in this Area
Purchase History
| Date | Buyer | Sale Price | Title Company |
|---|---|---|---|
| John W Chen T | -- | -- | |
| Chen John W | $283,500 | -- | |
| Proia Timothy J | $4,000 | -- | |
| Proia Timothy J | $150,000 | -- |
Source: Public Records
Mortgage History
| Date | Status | Borrower | Loan Amount |
|---|---|---|---|
| Previous Owner | Chen John W | $226,900 |
Source: Public Records
Tax History Compared to Growth
Tax History
| Year | Tax Paid | Tax Assessment Tax Assessment Total Assessment is a certain percentage of the fair market value that is determined by local assessors to be the total taxable value of land and additions on the property. | Land | Improvement |
|---|---|---|---|---|
| 2025 | $7,104 | $624,800 | $376,700 | $248,100 |
| 2024 | $6,493 | $575,100 | $364,300 | $210,800 |
| 2023 | $6,347 | $534,700 | $332,100 | $202,600 |
| 2022 | $5,830 | $461,200 | $284,600 | $176,600 |
| 2021 | $5,482 | $421,700 | $250,600 | $171,100 |
| 2020 | $5,353 | $412,100 | $241,000 | $171,100 |
| 2019 | $5,431 | $402,900 | $241,000 | $161,900 |
| 2018 | $5,203 | $366,700 | $214,900 | $151,800 |
| 2017 | $4,940 | $350,600 | $212,700 | $137,900 |
| 2016 | $4,890 | $345,800 | $207,900 | $137,900 |
| 2015 | $4,769 | $339,700 | $201,800 | $137,900 |
| 2014 | $4,809 | $336,500 | $198,600 | $137,900 |
Source: Public Records
Map
Nearby Homes