8 Rayton Rd Hanover, NH 03755
Estimated Value: $1,117,000 - $1,492,000
4
Beds
5
Baths
2,870
Sq Ft
$461/Sq Ft
Est. Value
About This Home
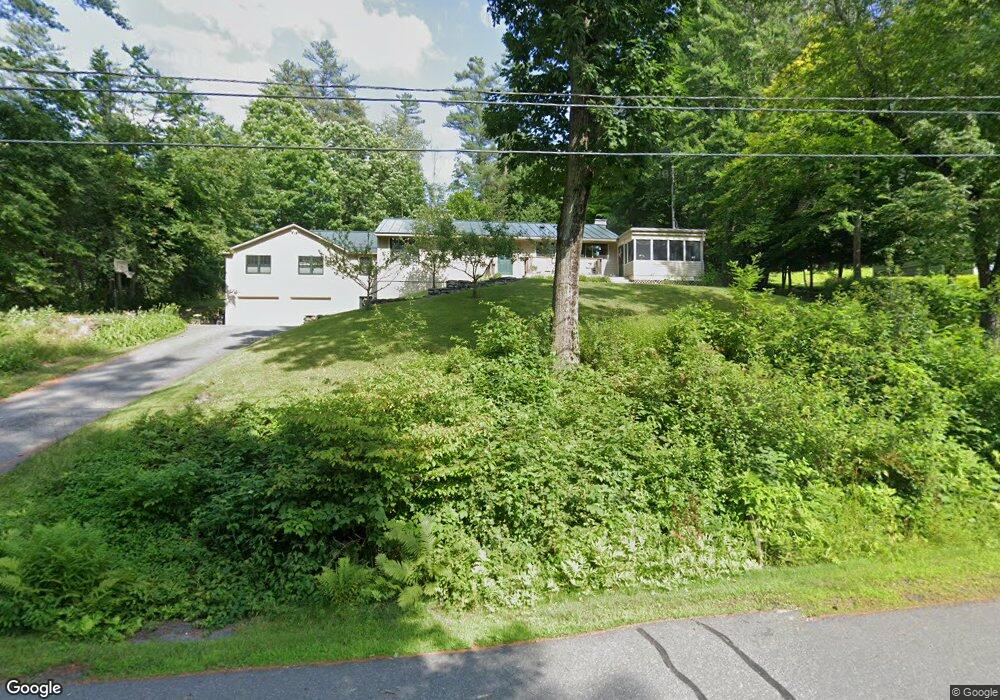
This home is located at 8 Rayton Rd, Hanover, NH 03755 and is currently estimated at $1,322,077, approximately $460 per square foot. 8 Rayton Rd is a home located in Grafton County with nearby schools including Bernice A. Ray School, Frances C. Richmond School, and Hanover High School.
Ownership History
Date
Name
Owned For
Owner Type
Purchase Details
Closed on
Sep 7, 2001
Sold by
Benson Susan
Bought by
Aspinwall Dwight C and Aspinwall Gayle M
Current Estimated Value
Home Financials for this Owner
Home Financials are based on the most recent Mortgage that was taken out on this home.
Original Mortgage
$240,000
Outstanding Balance
$86,497
Interest Rate
7.05%
Estimated Equity
$1,235,580
Purchase Details
Closed on
Aug 4, 1999
Sold by
Macleod John B and Macleod Joan L
Bought by
Benson Susan
Home Financials for this Owner
Home Financials are based on the most recent Mortgage that was taken out on this home.
Original Mortgage
$110,000
Interest Rate
7.54%
Create a Home Valuation Report for This Property
The Home Valuation Report is an in-depth analysis detailing your home's value as well as a comparison with similar homes in the area
Home Values in the Area
Average Home Value in this Area
Purchase History
| Date | Buyer | Sale Price | Title Company |
|---|---|---|---|
| Aspinwall Dwight C | $300,000 | -- | |
| Benson Susan | $206,000 | -- |
Source: Public Records
Mortgage History
| Date | Status | Borrower | Loan Amount |
|---|---|---|---|
| Open | Benson Susan | $240,000 | |
| Previous Owner | Benson Susan | $110,000 |
Source: Public Records
Tax History
| Year | Tax Paid | Tax Assessment Tax Assessment Total Assessment is a certain percentage of the fair market value that is determined by local assessors to be the total taxable value of land and additions on the property. | Land | Improvement |
|---|---|---|---|---|
| 2025 | $19,448 | $1,398,100 | $545,100 | $853,000 |
| 2024 | $17,825 | $925,000 | $387,100 | $537,900 |
| 2023 | $17,150 | $925,000 | $387,100 | $537,900 |
| 2022 | $16,456 | $925,000 | $387,100 | $537,900 |
| 2021 | $17,919 | $1,015,800 | $387,100 | $628,700 |
| 2020 | $13,894 | $687,500 | $300,500 | $387,000 |
| 2019 | $13,702 | $687,500 | $300,500 | $387,000 |
| 2018 | $13,221 | $687,500 | $300,500 | $387,000 |
| 2017 | $13,118 | $604,800 | $183,100 | $421,700 |
| 2016 | $12,876 | $604,800 | $183,100 | $421,700 |
| 2015 | $8,784 | $420,700 | $183,100 | $237,600 |
| 2014 | $8,427 | $420,700 | $183,100 | $237,600 |
| 2013 | $7,496 | $388,200 | $183,100 | $205,100 |
| 2012 | $7,383 | $399,300 | $187,500 | $211,800 |
Source: Public Records
Map
Nearby Homes
- 4 Haskins Rd
- 0 and 2.5 Balch Hill Ln
- 1 O'Leary Ave
- 2 Hilton Field Ln
- 3 Woodmore Dr
- 15 College Hill
- 27 College Hill Rd
- 14 Macdonald Dr
- 18 College Hill Rd Unit 18
- 85 Lebanon St
- 16 College Hill Rd
- 53 Lyme Rd Unit 27
- 53 Lyme Rd Unit 35
- 68 Lyme Rd
- 4 Occom Ridge
- 31 Forest Edge Dr
- 23 School St
- 11 Gile Dr Unit 1B
- 15 Gile Dr Unit 3A
- 4 Gile Dr Unit 2B
Your Personal Tour Guide
Ask me questions while you tour the home.