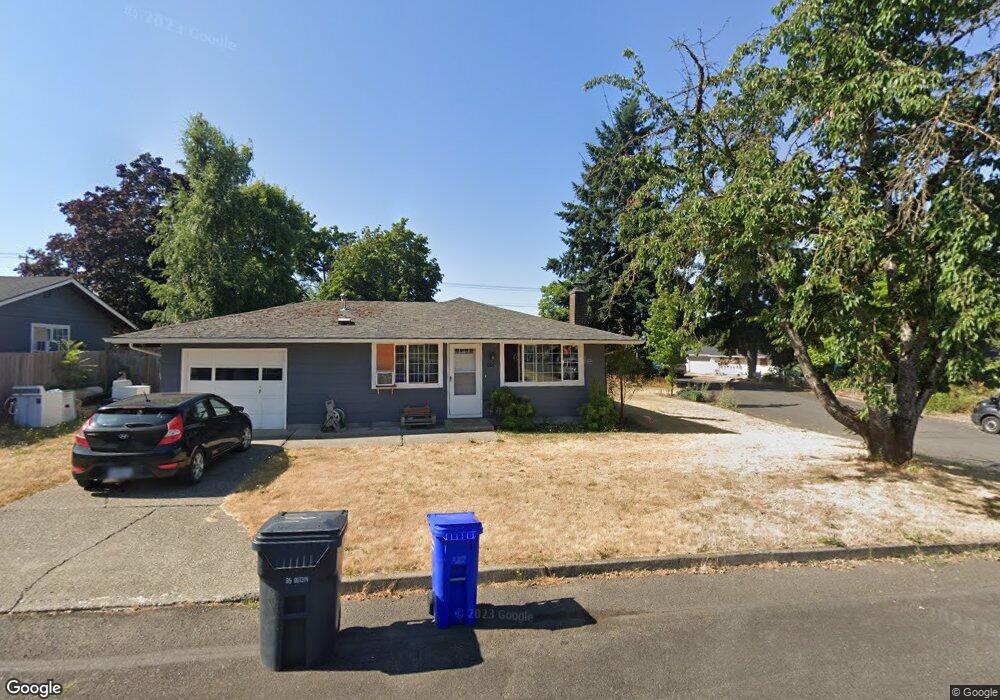
8 Revilot Ct Molalla, OR 97038
Estimated Value: $408,000 - $465,000
4
Beds
1
Bath
1,430
Sq Ft
$310/Sq Ft
Est. Value
About This Home
This home is located at 8 Revilot Ct, Molalla, OR 97038 and is currently estimated at $443,405, approximately $310 per square foot. 8 Revilot Ct is a home located in Clackamas County with nearby schools including Country Christian School and Oregon Outreach - Molalla Pride.
Ownership History
Date
Name
Owned For
Owner Type
Purchase Details
Closed on
May 20, 2019
Sold by
Baker Victoria H and Baker Errol G
Bought by
Baker Errol G and Baker Victoria H
Current Estimated Value
Purchase Details
Closed on
Sep 24, 2015
Sold by
Roe Patrick and Roe Jennifer M
Bought by
Baker Victoria H and Baker Errol G
Purchase Details
Closed on
Nov 23, 2012
Sold by
Roe Patrick
Bought by
Roe Patrick and Roe Jennifer M
Home Financials for this Owner
Home Financials are based on the most recent Mortgage that was taken out on this home.
Original Mortgage
$180,045
Interest Rate
3.36%
Mortgage Type
New Conventional
Purchase Details
Closed on
Jan 10, 2007
Sold by
Isley Allen J and Isley Darlene J
Bought by
Roe Patrick
Home Financials for this Owner
Home Financials are based on the most recent Mortgage that was taken out on this home.
Original Mortgage
$189,525
Interest Rate
6.12%
Mortgage Type
Purchase Money Mortgage
Create a Home Valuation Report for This Property
The Home Valuation Report is an in-depth analysis detailing your home's value as well as a comparison with similar homes in the area
Home Values in the Area
Average Home Value in this Area
Purchase History
| Date | Buyer | Sale Price | Title Company |
|---|---|---|---|
| Baker Errol G | -- | None Available | |
| Baker Victoria H | $217,500 | Ticor Title Company | |
| Roe Patrick | -- | None Available | |
| Roe Patrick | $199,500 | First American Title Insuran |
Source: Public Records
Mortgage History
| Date | Status | Borrower | Loan Amount |
|---|---|---|---|
| Previous Owner | Roe Patrick | $180,045 | |
| Previous Owner | Roe Patrick | $189,525 |
Source: Public Records
Tax History Compared to Growth
Tax History
| Year | Tax Paid | Tax Assessment Tax Assessment Total Assessment is a certain percentage of the fair market value that is determined by local assessors to be the total taxable value of land and additions on the property. | Land | Improvement |
|---|---|---|---|---|
| 2025 | $3,519 | $183,716 | -- | -- |
| 2024 | $3,402 | $178,366 | -- | -- |
| 2023 | $3,402 | $173,171 | $0 | $0 |
| 2022 | $2,805 | $168,128 | $0 | $0 |
| 2021 | $2,690 | $163,232 | $0 | $0 |
| 2020 | $2,615 | $158,478 | $0 | $0 |
| 2019 | $2,539 | $153,863 | $0 | $0 |
| 2018 | $2,468 | $149,382 | $0 | $0 |
| 2017 | $2,366 | $145,031 | $0 | $0 |
| 2016 | $2,243 | $140,807 | $0 | $0 |
| 2015 | $2,180 | $136,706 | $0 | $0 |
| 2014 | $2,112 | $132,724 | $0 | $0 |
Source: Public Records
Map
Nearby Homes
- 3 Revilot Ct
- 205 W Heintz St Unit 708
- 123 Shirley St
- 416 Kennel Ave
- 208 W Heintz St Unit 2
- 1341 Rachel Ln
- 1121 Rachel Ln
- 1101 Rachel Ln
- 1241 Rachel Ln
- 1291 Rachel Ln
- 871 Mary Dr
- 1141 Rachel Ln
- 1181 Rachel Ln
- 121 W Ross St
- 162 Fenton Ave Unit C
- 619 E Heintz St
- 118 Engle Ave
- 206 S Molalla Ave
- 207 Finneys Ave
- 122 N Cole Ave
- 6 Revilot Ct
- 601 Toliver Dr
- 115 Toliver Rd
- 604 Toliver Dr
- 606 Toliver Dr
- 4 Revilot Ct
- 9 Revilot Ct
- 113 Toliver Rd
- 7 Revilot Ct
- 602 Toliver Dr
- 608 Toliver Dr
- 625 Creamery Creek Ln
- 625 Creamery Creek Dr
- 111 Toliver Rd
- 5 Revilot Ct
- 645 Creamery Creek Dr
- 2 Revilot Ct
- 665 Creamery Creek Dr
- 610 Toliver Dr
- 10 Berwick Ct