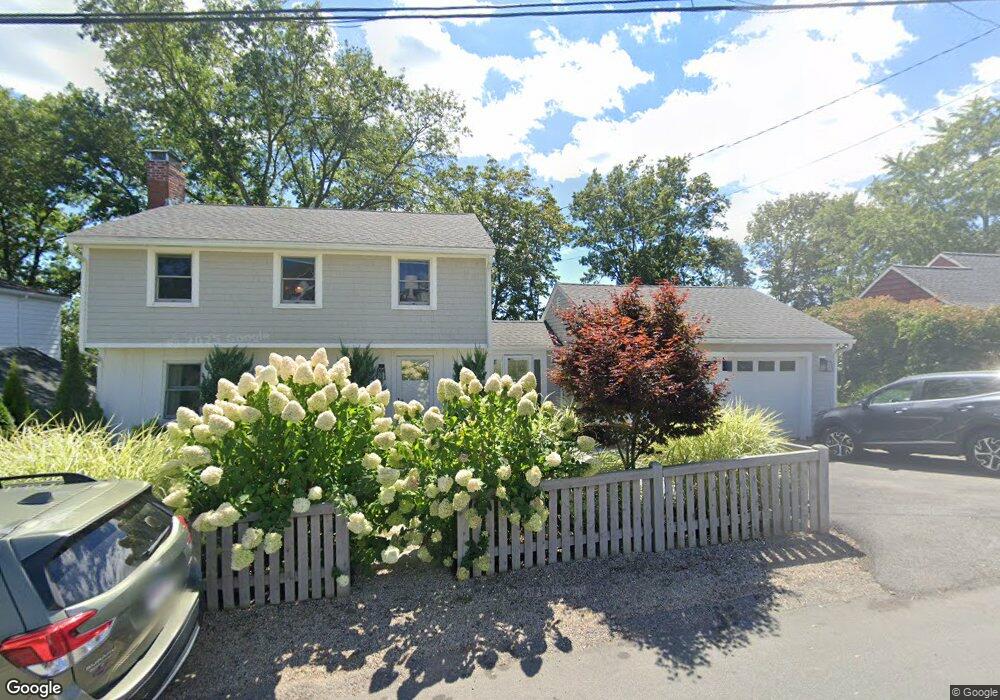
8 Rice Rd Hingham, MA 02043
Crow Point NeighborhoodEstimated Value: $1,015,000 - $1,182,000
3
Beds
2
Baths
1,588
Sq Ft
$691/Sq Ft
Est. Value
About This Home
This home is located at 8 Rice Rd, Hingham, MA 02043 and is currently estimated at $1,096,612, approximately $690 per square foot. 8 Rice Rd is a home located in Plymouth County with nearby schools including William L. Foster Elementary School, Hingham Middle School, and Hingham High School.
Ownership History
Date
Name
Owned For
Owner Type
Purchase Details
Closed on
Sep 29, 2008
Sold by
Molinari Paul M and Molinari Stephanie A
Bought by
Nagle Michael and Nagle Nicolle
Current Estimated Value
Home Financials for this Owner
Home Financials are based on the most recent Mortgage that was taken out on this home.
Original Mortgage
$379,950
Outstanding Balance
$254,350
Interest Rate
6.57%
Mortgage Type
Purchase Money Mortgage
Estimated Equity
$842,262
Purchase Details
Closed on
Jun 27, 2002
Sold by
Talbot Richard S and Talbot Maura B
Bought by
Molinari Paul M and Molinari Stephanie A
Purchase Details
Closed on
Apr 30, 1998
Sold by
Gonczarek Walter and Gonczarek Regina
Bought by
Talbot Richard S and Talbot Marua B
Create a Home Valuation Report for This Property
The Home Valuation Report is an in-depth analysis detailing your home's value as well as a comparison with similar homes in the area
Home Values in the Area
Average Home Value in this Area
Purchase History
| Date | Buyer | Sale Price | Title Company |
|---|---|---|---|
| Nagle Michael | $505,000 | -- | |
| Molinari Paul M | $440,000 | -- | |
| Talbot Richard S | $242,500 | -- |
Source: Public Records
Mortgage History
| Date | Status | Borrower | Loan Amount |
|---|---|---|---|
| Open | Talbot Richard S | $379,950 | |
| Previous Owner | Talbot Richard S | $359,650 |
Source: Public Records
Tax History
| Year | Tax Paid | Tax Assessment Tax Assessment Total Assessment is a certain percentage of the fair market value that is determined by local assessors to be the total taxable value of land and additions on the property. | Land | Improvement |
|---|---|---|---|---|
| 2025 | $9,828 | $919,400 | $517,000 | $402,400 |
| 2024 | $9,594 | $884,200 | $517,000 | $367,200 |
| 2023 | $8,509 | $850,900 | $517,000 | $333,900 |
| 2022 | $8,076 | $698,600 | $430,900 | $267,700 |
| 2021 | $8,288 | $702,400 | $448,800 | $253,600 |
| 2020 | $8,099 | $702,400 | $448,800 | $253,600 |
| 2019 | $8,103 | $686,100 | $448,800 | $237,300 |
| 2018 | $7,917 | $672,600 | $448,800 | $223,800 |
| 2017 | $7,223 | $589,600 | $423,000 | $166,600 |
| 2016 | $5,704 | $456,700 | $290,100 | $166,600 |
| 2015 | $5,550 | $442,900 | $276,300 | $166,600 |
Source: Public Records
Map
Nearby Homes
- 12 Daley Rd
- 17 Paige St
- 190 South St Unit B
- 191 South St
- 2 Langlee Rd
- 225 South St Unit 1
- 43 Park View Dr
- 37 Foley Beach Rd
- 21 Hersey St
- 19 Lantern Ln
- 16 Foley Beach Rd
- 160 Hms Stayner Dr
- 160 Hms Stayner Dr Unit 160
- 151 Stayner Dr Unit 151
- 6 Adams Ct
- 81 Kimball Beach Rd
- 132 Hms Stayner Dr Unit 132
- 1 Squirrel Hill Ln
- 9 Barnes Rd
- 112 Martins Ln
Your Personal Tour Guide
Ask me questions while you tour the home.