8 Ridgeview Ave Darien, CT 06820
Estimated Value: $1,081,000 - $1,241,000
3
Beds
3
Baths
1,632
Sq Ft
$706/Sq Ft
Est. Value
About This Home
This home is located at 8 Ridgeview Ave, Darien, CT 06820 and is currently estimated at $1,151,399, approximately $705 per square foot. 8 Ridgeview Ave is a home located in Fairfield County with nearby schools including Ox Ridge Elementary School, Middlesex Middle School, and Darien High School.
Ownership History
Date
Name
Owned For
Owner Type
Purchase Details
Closed on
Aug 13, 2022
Sold by
Mitrione Jeffrey and Mitrione Michelle
Bought by
Waheed Hassnain and Kadeer Qandeel
Current Estimated Value
Purchase Details
Closed on
Nov 22, 2019
Sold by
Badalian Ernest and Shakhnazarian Lora
Bought by
Yang Ming and Zhang Zhi
Home Financials for this Owner
Home Financials are based on the most recent Mortgage that was taken out on this home.
Original Mortgage
$287,500
Interest Rate
3.6%
Purchase Details
Closed on
Mar 28, 2008
Sold by
Zhou Weidong and Wang Shijin
Bought by
Mitrione Jeffrey and Baselice Michelle
Purchase Details
Closed on
Jan 3, 2006
Sold by
Heusted Barbara D and Heusted Robert S
Bought by
Zhou Weidong and Wang Shilin
Purchase Details
Closed on
Feb 17, 1988
Sold by
Gropp Geoffrey
Bought by
Housted Barbara
Create a Home Valuation Report for This Property
The Home Valuation Report is an in-depth analysis detailing your home's value as well as a comparison with similar homes in the area
Home Values in the Area
Average Home Value in this Area
Purchase History
| Date | Buyer | Sale Price | Title Company |
|---|---|---|---|
| Waheed Hassnain | $840,000 | None Available | |
| Yang Ming | $575,000 | -- | |
| Mitrione Jeffrey | $640,000 | -- | |
| Zhou Weidong | $625,000 | -- | |
| Housted Barbara | $315,000 | -- |
Source: Public Records
Mortgage History
| Date | Status | Borrower | Loan Amount |
|---|---|---|---|
| Previous Owner | Yang Ming | $287,500 | |
| Previous Owner | Housted Barbara | $100,000 | |
| Previous Owner | Housted Barbara | $320,000 | |
| Previous Owner | Housted Barbara | $360,000 |
Source: Public Records
Tax History
| Year | Tax Paid | Tax Assessment Tax Assessment Total Assessment is a certain percentage of the fair market value that is determined by local assessors to be the total taxable value of land and additions on the property. | Land | Improvement |
|---|---|---|---|---|
| 2025 | $9,482 | $612,500 | $394,450 | $218,050 |
| 2024 | $8,998 | $612,500 | $394,450 | $218,050 |
| 2023 | $8,428 | $478,590 | $315,560 | $163,030 |
| 2022 | $8,116 | $471,030 | $315,560 | $155,470 |
| 2021 | $7,932 | $471,030 | $315,560 | $155,470 |
| 2020 | $7,706 | $471,030 | $315,560 | $155,470 |
| 2019 | $7,758 | $471,030 | $315,560 | $155,470 |
| 2018 | $7,297 | $453,810 | $294,770 | $159,040 |
| 2017 | $7,334 | $453,810 | $294,770 | $159,040 |
| 2016 | $7,157 | $453,810 | $294,770 | $159,040 |
| 2015 | $6,966 | $453,810 | $294,770 | $159,040 |
| 2014 | $6,812 | $453,810 | $294,770 | $159,040 |
Source: Public Records
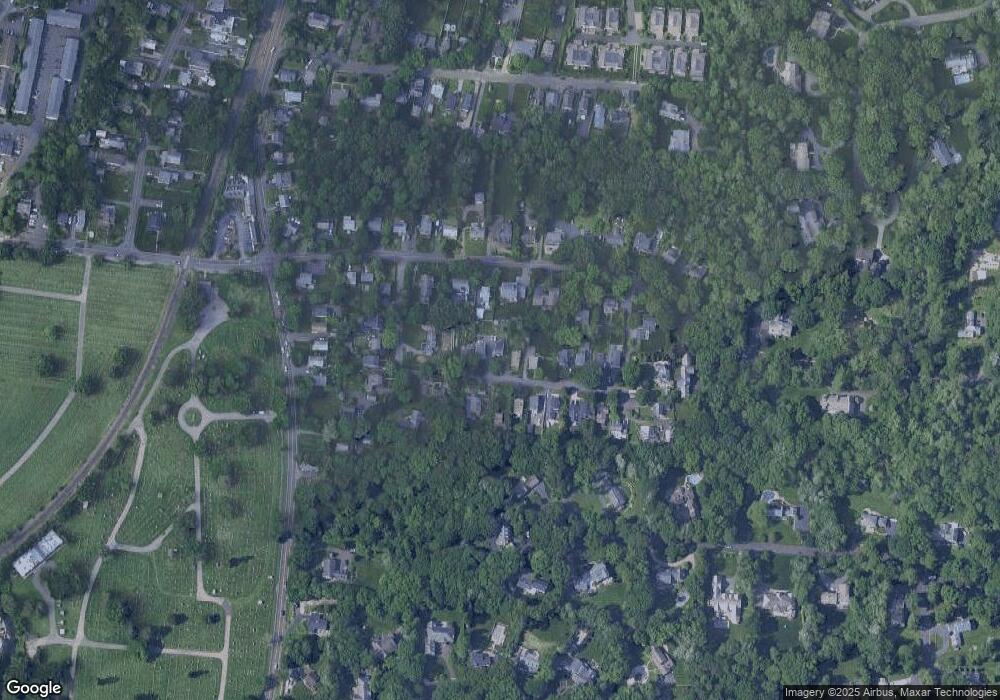
Map
Nearby Homes
- 112 Camp Ave
- 23 Greenwood Ave
- 85 Camp Ave Unit 3B
- 85 Camp Ave Unit 18B
- 72 Highview Ave
- 5 Wheat Ln
- 40 Oenoke Place Unit 13
- 17 Oenoke Place
- 473 Hollow Tree Ridge Rd
- 27 Northill St Unit 5S
- 27 Northill St Unit 5N
- 910 Hope St Unit 5B
- 39 Woodway Rd Unit C7
- 59 Woodway Rd Unit 1
- 19 Woodway Rd Unit 26
- 49 Minivale Rd
- 8 Barnstable Ln
- 7 Barnstable Ln
- 15 Waterbury Ln
- 28 Crestview Ave
- 8 Ridgeview Ave
- 8 1/2 Ridgeview Ave
- 16 Ridgeview Ave
- 6 Ridgeview Ave
- 81/2 Ridgeview Ave
- 10 Ridgeview Ave
- 55 Camp Ave
- 10 Spring Grove St
- 14 Spring Grove St
- 9 Ridgeview Ave
- 11 Ridgeview Ave
- 51 Camp Ave
- 65 Camp Ave
- 53 Camp Ave
- 20 Ridgeview Ave
- 15 Ridgeview Ave
- 22 Ridgeview Ave
- 17 Ridgeview Ave
- 57 Camp Ave
- 21 Ridgeview Ave
Your Personal Tour Guide
Ask me questions while you tour the home.