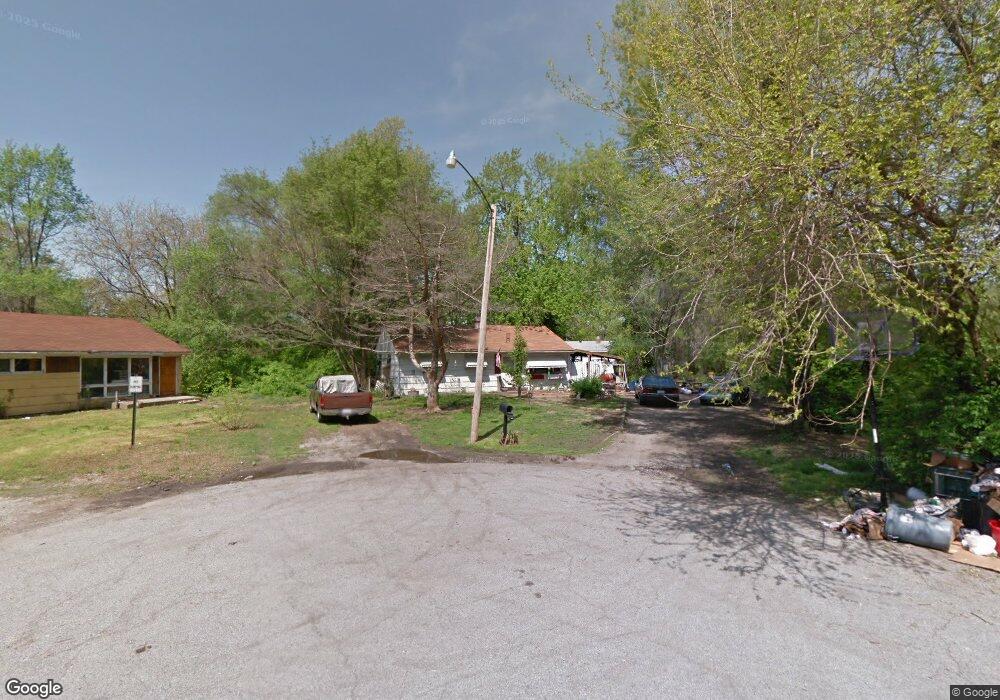
8 Robin Ct East Saint Louis, IL 62206
Estimated Value: $34,000 - $61,566
3
Beds
1
Bath
936
Sq Ft
$51/Sq Ft
Est. Value
About This Home
This home is located at 8 Robin Ct, East Saint Louis, IL 62206 and is currently estimated at $48,142, approximately $51 per square foot. 8 Robin Ct is a home located in St. Clair County.
Ownership History
Date
Name
Owned For
Owner Type
Purchase Details
Closed on
Sep 23, 2016
Sold by
Saint Clair County
Bought by
Stanley Mollie
Current Estimated Value
Purchase Details
Closed on
Jul 25, 2016
Sold by
Jines Glynna A
Bought by
County Of Saint Clair and Trust #07-08 0-106-038
Purchase Details
Closed on
Mar 25, 2010
Sold by
Secretary Of Housing & Urban Development
Bought by
Jines Glynna A
Purchase Details
Closed on
Aug 20, 2008
Sold by
Midfirst Bank
Bought by
Secretary Of Housing & Urban Development
Purchase Details
Closed on
Aug 10, 2007
Sold by
Hud
Bought by
Midfirst Bank
Purchase Details
Closed on
Mar 5, 2007
Sold by
Brown Ernestine
Bought by
Hud
Create a Home Valuation Report for This Property
The Home Valuation Report is an in-depth analysis detailing your home's value as well as a comparison with similar homes in the area
Home Values in the Area
Average Home Value in this Area
Purchase History
| Date | Buyer | Sale Price | Title Company |
|---|---|---|---|
| Stanley Mollie | -- | Attorney | |
| County Of Saint Clair | -- | Attorney | |
| Jines Glynna A | -- | Lakeside Title & Escrow Agen | |
| Secretary Of Housing & Urban Development | -- | None Available | |
| Midfirst Bank | -- | None Available | |
| Hud | -- | None Available |
Source: Public Records
Tax History Compared to Growth
Tax History
| Year | Tax Paid | Tax Assessment Tax Assessment Total Assessment is a certain percentage of the fair market value that is determined by local assessors to be the total taxable value of land and additions on the property. | Land | Improvement |
|---|---|---|---|---|
| 2024 | $239 | $1,602 | $462 | $1,140 |
| 2023 | $215 | $1,448 | $418 | $1,030 |
| 2022 | $184 | $1,269 | $366 | $903 |
| 2021 | $191 | $1,203 | $347 | $856 |
| 2020 | $210 | $1,260 | $364 | $896 |
| 2019 | $217 | $1,260 | $364 | $896 |
| 2018 | $220 | $1,278 | $369 | $909 |
| 2017 | $209 | $1,247 | $360 | $887 |
| 2016 | $0 | $6,421 | $359 | $6,062 |
| 2014 | $980 | $6,351 | $355 | $5,996 |
| 2013 | $138 | $5,957 | $333 | $5,624 |
Source: Public Records
Map
Nearby Homes